Creating a top n report
To create a top n or bottom n summary report, insert the aggregate data in the header or footer row. Then create a filter for the group that contains the data, and use a filter condition, as shown in the following examples:
//Show only the top ten orders
row["Total_Sales"] Top n 10
//Show only orders in the top ten percent
row["Total_Sales"] Top Percent 10
//Show only the lowest five orders
row["Total_Sales"] Bottom n 5
//Show only orders in the bottom one percent
row["Total_Sales"] Bottom Percent 1
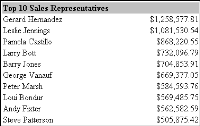
Figure 10‑25 shows a top ten report.
Figure 10‑26 shows the report design.
Figure 10‑25 Top ten report
Figure 10‑26 Top ten report design
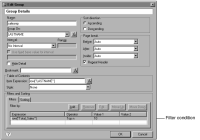
The data elements that display the sales representative names and their sales totals are in a group header row. This report groups sales data rows (not shown in the report) by sales representatives. To display only the top ten sales representatives, a filter is specified in the group definition, as shown in
Figure 10‑27.
Figure 10‑27 Defining a top ten filter in the group


