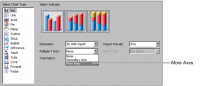
Charts support displaying data on more than one
y-axis. Additional
y-axes can use a different scale from the first
y-axis. To create a second
y-axis, use the Select Chart Type page. In Multiple Y Axis, select Secondary Axis or More Axes, as shown in
Figure 20‑19. The chart preview shows a second
y-axis on the opposite side of the chart to the first
y-axis after a selection of Secondary Axis. For a selection of More Axes, additional axes appear in the preview only after creation of each axis.
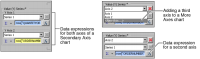
After enabling multiple axes, specify data for all additional axes. Define the
y-, but not the
x-axis, of each additional axis. The category
x‑axis and optional grouping definitions apply to all
y-axes. In Select Data, provide the expression for the second and any subsequent
y-axes, as shown in
Figure 20‑20.