Reviewing application logs
The Application log option allows the administrator to browse log data to monitor system performance and troubleshoot problems. The option provides the following choices, as shown in
Figure 1‑22:

Type
Select one of the following events to filter log data:
Fatal
Serious Error that disables the execution of the application.
Error
Error that occurs during the execution of a specific action which does not allow the application to perform a corrective action
Warning
Incident or non-fatal error detected while performing an action.
Info
General information regarding application processing activity.
Debug
Problem-tracking information used by the administrator for troubleshooting system issues.
Audit
Security-related information regarding processing activity specified for audit or special tracking.
Sensitive Data
Information regarding processing activity on data designated as sensitive.
User
Search the log to find all entries related to the specified user. There is no need to indicate the complete name because the search finds all entries containing the specified character string in any part of the name.
Message
Search log to find all entries containing the character string specified in the Message field.
Starting date and Ending date
Limit log searches to a range of dates.
Figure 1‑22 Searching the application log
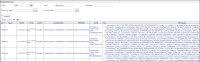
The query results contain the following information, as shown in
Figure 1‑23:
ID
Unique log identifier
Type
Type of error message: Fatal, Error, Warning, Info, Debug, Audit, or SensitiveData
Date
Log entry date
Time
Log entry time
User
User to whom the log entry relates
Component
BIRT Analytics application component that generated the entry
Method
BIRT Analytics application method that caused the log entry
GUID
Graphic user identifier for tracking the log entry
IP
IP address of the client that caused the log entry
Message
Error or informational message written to the log
Figure 1‑23 Viewing application log data