Using crosstabs
A crosstab is an analysis that supports cross-tabulation, or pivoting, of different fields from a data source. The discrete values in a field are used as labels for either rows or columns. The default value for the cells in the table is the count of records that match the intersection of the column and row value. You can, however, add a data value for the cells separately.
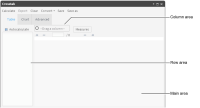
Figure 4‑1 The crosstab window
For example, you can set customer gender for columns, resulting in one column for male and one column for female. Then, you can set product line for rows, resulting in a row for each product line. The cells of the table by default show total product line purchases by male and female customers. Instead, you can show average product line profit by male and female customers or maximum product line unit sales per order for male and female customers.
A crosstab that defines only rows is called non-pivoted. In a non-pivoted crosstab, a column appears for each field and rows appear labelled with the discrete values from those fields. The single, generated column on a non-pivoted table shows counts of records for each row combination.
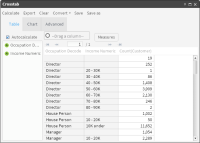
Figure 4‑2 shows an example of a non-pivoted crosstab.
Figure 4‑2 Creating a non-pivoted crosstab
When you have specified a resolution table that is different from the axis table and is at a higher resolution, use a field from the resolution table as a column. In other words, if the table results, or cell values, come from a different table than the row labels, you must use a pivoted crosstab. For example, to analyze Customer Occupation and Income Bracket at a higher level, by Household, define Occupation and Income Bracket fields as rows on a pivoted crosstab. Then, change the resolution table for the existing measure from Customer to Household, and add Household Country as a column.
When considering two fields to use in a crosstab, you typically use the field with more discrete values to label rows. Fields with a very high number of discrete values are less useful as a basis for pivoting a data set.