Standardizing data in a column
There are four ways to standardize the data in a column:

Normalization
Linear scaling
Logistic scaling
Softmax scaling
In each case, a new column is created to contain the standardized data.
Understanding normalization
Normalization calculates the mean of all values in a column. Each value in the new column compares in the same way to values in a standard, normal distribution. The operation subtracts the mean value from each value in the column, then divides the difference by the standard deviation. The formula is:
y = (x - mean{x1, xN}) / (stdv{x1, xN})
Standard deviation shows how much variation there is from the average (mean), or expected value. A low standard deviation indicates that the data points tend to be very close to the mean. A high standard deviation indicates that the data points are spread out over a large range of values.
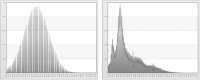
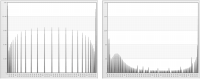
Figure 6‑2 shows normalized data for age and income. The values on the horizontal axis represent the number of standard deviations from the mean. The standard deviation of the mean is 0.
Figure 6‑2 Normalized data for age (left) and income (right)
Understanding linear scaling
Standardization by linear scaling is useful when values in a column have the following characteristics:
Many similar values
Very extreme minimum and/or maximum values that are highly concentrated
The more the data are clustered, the better the result obtained by linear regression study. Maximum and/or minimum values are calculated to be suitable to perform linear regression analysis. Linear scaling supports two options:
Use the original minimum and maximum values.
Add a stretch to the minimum and maximum values. This option adds, according to the percentage indicated, a minimum and maximum value before the data is preprocessed.
The formula is:
y = (x - min{x1, xN}) / (max{x1, xN} - min{x1, xN})
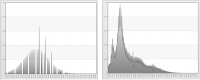
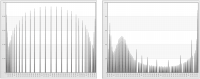
Figure 6‑3 shows linear scaling with the original minimum and maximum values for age and income.
Figure 6‑3 Linear scaling with original minimum and maximum values for age (left) and income (right)
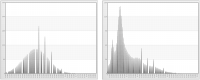
Figure 6‑4 shows linear scaling with a stretch to the minimum and maximum values for age and income.
Figure 6‑4 Linear scaling with a stretch to the minimum and maximum values for age (left) and income (right)
Understanding logistic scaling
Standardization by logistic scaling is used to recode the variable of study for use in a logistic regression. Logistic regression is a type of regression analysis used for predicting the outcome of a categorical dependent variable (a dependent variable that can take on a limited number of values) based on one or more predictor variables. The equation used is:
P(n) = 1/(1 + e-n)
where n represents the values in the column. This equation analyzes the values to form a logistic model.
Understanding Softmax scaling
Softmax scaling standardization is a nonlinear transformation that reduces data ranges for the values in a column as much as possible. The objective is to achieve the minimum and maximum values asymptotically. In other words, the low-end and high-end values gradually approach the minimum and maximum values without ever reaching them.
If you choose Softmax scaling, you can set the confidence level to 68%, 95%, or 99%. The lower the confidence level is, the shorter the intervals and the greater the probability of error will be. The formula is:
x’ = x - E(x) / λ(σx/2π)
where
x represents the values in the column.
E(x) is the average value.
λ is the confidence level.
σx is the standard deviation of the study variable.
π is the number 3.14159…
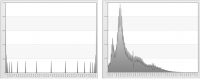
Figure 6‑5 shows Softmax scaling at 68% for age and income.
Figure 6‑5 Softmax scaling at 68% for age (left) and income (right)
Figure 6‑6 shows Softmax scaling at 95% for age and income.
Figure 6‑6 Softmax scaling at 95% for age (left) and income (right)
Figure 6‑7 shows Softmax scaling at 99% for age and income.
Figure 6‑7 Softmax scaling at 99% for age (left) and income (right)
How to standardize the data in a column
1 In Analytics—Advanced, choose Preprocessing➛Standardize Column.
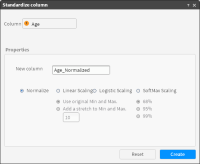
2 Drag the column you want to standardize from My Data and drop it in Column in Standardize column, shown in
Figure 6‑8.
3 In New column, type the name of the new column.
4 Choose Normalize, or choose one of the scaling algorithms: linear scaling, logistic scaling, or SoftMax scaling. If you choose linear scaling or SoftMax scaling, you can customize the scaling.
5 Choose Create. The column appears in My Data.
Figure 6‑8 Standardizing the data in a column