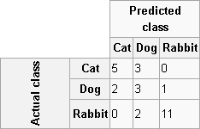
A confusion matrix tabulates the results of a predictive algorithm. Each row of the matrix represents an actual class. Each column represents a predicted class. For example, consider a classification system that has been trained to distinguish between cats, dogs, and rabbits.
Figure 6‑12 shows how frequently the predictive algorithm correctly classifies each type of animal. The sample contains 27 animals: 8 cats, 6 dogs, and 13 rabbits. Of the 8 cats, the algorithm predicted that three are dogs, and of the six dogs, it predicted that two are cats and one is a rabbit. The confusion matrix shows that the algorithm is not very successful distinguishing between cats and dogs. It is, however, successful distinguishing between rabbits and other types of animals, misclassifying only two of 13 rabbits. Correct predictions are tallied in the table’s diagonal. Non-zero values outside the diagonal indicate incorrect predictions.