Converting data measures to another indicator type
Data measures that you define for one BIRT Analytics indicator may appear on another indicator. Convert lists indicators for which a calculated indicator supports conversion.
How to convert a dial to a meter
1 In Data Tree, select My Folders.
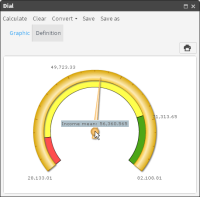
2 Locate and open a previously saved dial. Choose Calculate. The dial appears on Graphic, as shown in
Figure 5‑12.
Figure 5‑12 Visualizing a data measure using a dial
3 Select Convert, then choose Meter.
4 Choose Definition, then view the Measures, Values, and Properties tabs.
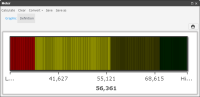
5 Choose Calculate. The new meter appears on Graphic, as shown in
Figure 5‑13.
Figure 5‑13 Visualizing a data measure using a meter
How to convert a dial graph to a sphere
1 For a calculated dial, select Convert, then choose Sphere.
2 To view Measures, Values, and Properties, choose Definition.
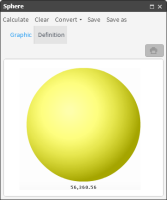
3 Choose Calculate. The new sphere appears on Graphic, as shown in
Figure 5‑14.
Figure 5‑14 Visualizing a data measure using a sphere
How to convert a dial graph to a cylinder
1 For a calculated dial, select Convert, and choose Cylinder.
2 To view Measures, Values, and Properties, choose Definition.
3 Choose Properties.
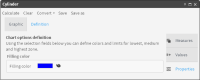
4 Using the palette, choose a color, as shown in
Figure 5‑15.
Figure 5‑15 Formatting properties of a data visualization gadget
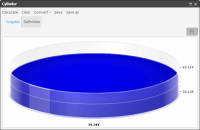
5 Choose Calculate. The cylinder appears on Graphic, as shown in
Figure 5‑16.
Figure 5‑16 Visualizing a data measure using a cylinder
Related topics
Video tutorials