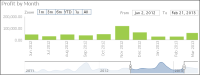
In Interactive viewer, if your chart contains a time range selector or a time line slider bar you can view specific time intervals in area, bar, column, difference, line, scatter, and stock charts. Figure 8‑29 shows a chart displaying the time range selector and bottom slider.
Figure 8‑29 Enabling the timeline option in a column chart
The time range selector appears below the chart title and enables you to view details in small time intervals, year to date, one year, in addition to all the values displayed in the chart. The time range slider appears at the bottom of the chart and enables you to select a time period by sliding a bar to the beginning or end of the time period. When the category is a time field, you can select the time range selector and bottom slider.