Understanding the order of Metrics Management calculations
Metrics Management calculates values based on the location and period consolidation functions and by executing formulas.
Period consolidation can perform Sum, Average or Take Last Known Value functions.
Location consolidation can perform Sum or Average functions. These are applied to the fully broken down Measure (M), Location (L), and Period (P) components at the Leaf level.
The order of calculation can be MLP, MPL, PML, PLM, LPM, and LMP. All indicate the order in which Metrics Management breaks items down to get to the lowest level of the hierarchies. Most of the time, MLP is the order of calculation. MLP satisfies the calculation requirements of most measures.
For example:
The Margin, Profit, and Sales measures all have the same order of calculation: MLP.
Profit and Sales are data measures.
Margin is a formula measure, where Margin = Profit/Sales * 100.
The Completed period is March and all measures are consolidating as This Year To Date.
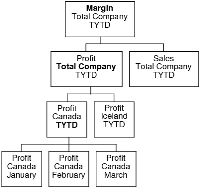
Figure 5‑5 shows an example of how Metrics Management calculates a data value based on an MLP order of calculation.
Figure 5‑5 A view with an MLP order of calculation
Margin is composed of two submeasures: Profit and Sales.
Profit is a leaf node that aggregates profit values for the Total Company location.
Canada is a leaf node in locations that aggregates profit values for the periods from This Year To Date.
Profit, Canada and the months are all leaf nodes. Metrics Management aggregates values based on Profit’s consolidation settings. The same process is done for Sales.
For a formula measure, the measure has the greatest affect upon the calculation. The order of calculation proceeds from left to right. In this case, the right-most items after M are never used. If a formula measure has an order of calculation of MLP, L and P are never broken down into leaf nodes from the formula level. This breakdown is accounted for when Profit and Sales are broken down.
Metrics Management aggregates values for each leaf node by applying the measure’s consolidation functions. The value of Profit for Canada in the preceding figure aggregates values from right to left for Period, Location, and then Measure. The Profit value equals a Sum across Period Consolidations. Metrics Management uses the function specified, and sums the values of Profit for Canada across January, February, and March.
Metrics Management then reassembles the locations based on the Location consolidation function. The Location consolidation is set to Average. For example, the total company locations’ profit value equals Canada’s Year To Date Total plus Iceland’s Year To Date Total, divided by two.
Metrics Management then reassembles the measure. In this case, Profit has no subcomponents to assemble, nor does Sales.
Metrics Management then reassembles total Profit for Total Company and the total Sales for Total Company at the Margin level, executing the formula on the aggregated data. To calculate the Margin and final result, the formula is executed on the subcomponents of Margin. So Margin = Profit for Total Company / Sales for Total Company x 100.