A performance management system succeeds when it provides relevant facts and data about current performance, and highlights what needs to be improved. Management’s challenge is to turn raw data into useful information.
To calculate the performance of a measure, Metrics Management uses comparatives, indexing, and performance ranges and colors.
About comparatives
Without comparative data, it is difficult to determine how a measure performs. Metrics Management uses comparative data to calculate an index value for every measure. Index values standardize the measurement of performance across different types of measures, so that you can compare them.
For measures to be meaningful, compare them to some kind of target or benchmark, which is called a comparative. Common comparatives are budgets, targets, previous year results, and internal or external benchmarks.
For example, the On-time delivery measure has an actual value of 640. To give this value meaning, compare the actual data to the target comparative of 800. The following comparison shows that on-time delivery is not performing as expected and gives you a relative idea of how far off target the performance is:
Actual = 640
Target = 800
About indexing
Metrics Management uses an indexing system to evaluate a measure’s actual performance instead of comparative data, so that an index over 100% is always positive, and below 100% is always negative.
On-time delivery = 640
Target on-time delivery = 800
Index = 80%
In this simple example, the performance is poor, as compared against the target. Specifically, the On-time delivery measure is performing at 20% below the performance goal compared with the target.
For some measures, such as sales figures, a high value is good. For others, such as the number of complaints you receive, high values are bad. When you set up measures in Metrics Management, you specify the measure’s polarity. That is, you specify whether high values are positive or negative. Metrics Management uses this polarity setting when it computes a measure’s index.
If high values are positive, the formula for an index is:
100 + (Base – Comparative)/|Comparative| * 100
If high values are negative, the formula for an index is:
100 – (Base – Comparative)/|Comparative| * 100
In each formula:
|Comparative|
is the absolute value of Comparative.
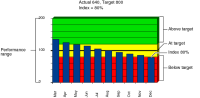
Index charts can show trends in index values over time. In Figure 1‑5, compared with the target, on-time delivery has deteriorated from being better than target, to the current level, which is well below target. You can view an index chart in the dashboard in briefing books, maps, and views.
Figure 1‑5 Index chart of performance trends
About performance colors and performance ranges
Performance colors provide a visual cue that clearly identifies variances in performance. A measure displays a performance color depending on how it is performing. Typically, a manager sees that red indicates poor performance, yellow indicates caution, and green indicates good performance. Gray indicates that there is missing or invalid data for that time period.
To determine a measure’s performance color, a measure’s index value is matched against one of five performance ranges. Each range has an upper and lower index value. The range of index values is 0% through 200%. Each range has a performance color and performance indicator, such as good. Performance ranges are defined for your entire database or for individual measures.
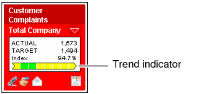
For example, in Figure 1‑6 the Customer Complaints measure displays a red performance color and an index value of 94.7%. By default, a measure with an index value between 50 and 95 displays a red performance color.
About trend indicators
By default, a measure displays a trend indicator. The trend indicator is an arrow that contains color-coded bars. Each bar indicates the measure’s performance for a previous period. The bar at the tip of the arrow displays the most recent period. The number of periods displaying depends on the view’s selected period and period range settings. The indicator displays a maximum of 14 periods. In Figure 1‑6, the indicator shows performance for the first eight months of the year.