Maps graphically represent measure performance in an alternative format to the hierarchy found in the view. Maps contain diagrams that display performance information and that can link to other Metrics Management objects, such as a book or view. Typical examples of maps include strategy maps, process maps, geographical maps, and cause and effect diagrams.
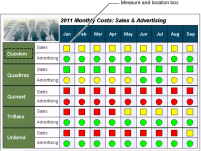
Figure 1‑8 shows a map that contains Sales and Advertising performance measures by month and location.