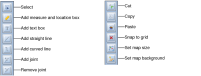
Map Designer, as shown in Figure 4‑23, is the visual tool you use to create maps. In Map Designer, you can add measure and location boxes and text boxes, and use lines and arrows to create a relationship between the boxes. You can also add a background image to the map, change the map size, and specify the default measure and location or text box selection.
2 In Map Contents, choose Design Map. The Map Designer opens in a new window.
How to save changes in the Map Designer from Setup➛Maps
When you open the Map Designer from Setup➛Maps, save changes by performing one of the following tasks:
Choose Apply to save without closing the Map Designer.
Choose OK to close the Map Designer. Then, choose Save.
How to undo or redo a map action in the Map Designer
Maps support undoing or redoing a change made to a map in the Map Designer. To undo a change, right-click and choose Undo action, as shown in Figure 4‑25. To reverse an undo action, right-click and choose Redo action.
Figure 4‑25 Choosing to undo a map action
Defining a map background
You can add a background image and a background color to a map. A background image can give context to measure and location boxes. For example, use a strategy map image containing rows that you can add specific measures and locations to when you design the map. Note that you must create an image in Metrics Management first to use it in a map.
You can also define a color as a map background. If you use both a background image and color, the image displays on top of the background color.
How to add a background image to a map
1 In the Map Designer toolbar, choose Set Map Background.
2 In Map background, select an image from the list. A preview of the image appears, as shown in Figure 4‑26.
Figure 4‑26 Choosing a background image
3 To define a background color, perform the following tasks, then choose OK:
1 Choose Color.
2 In Select color, select All colors, Shades of gray, or Standard Metrics Management index range colors.
3 Choose the color box and select a color from the palette.
4 Choose OK.
Changing the size of a map
In the Map Designer, the dashed red line indicates the size of map. You can provide pixel values to manually increase or decrease the size of the map. Alternatively, you can permit Metrics Management to resize the map area. Metrics Management adjusts the map area to accommodate either the maximum size of the image in the map background, or map objects that are outside of the background area.
How to change the size of a map
1 Choose Set Map Size.
2 In Map size, perform one of the following tasks:
To manually change the map size, deselect Automatic in Width and Height, and change the pixel values in Pixels.
To allow Metrics Management to adjust the size of the map area, select Automatic in both Width and Height, as shown in Figure 4‑27.
Figure 4‑27 Choosing to permit Metrics Management to adjust the map size
3 Choose OK.
Creating a measure and location box
You can add a measure and location box to a map, and specify settings for the box. Measures or locations can be unavailable to measure and location boxes, depending on the choices made in Map Contents in Setup➛Maps in the Windows client. Depending on Map Contents settings, you can choose to define the following items for a measure and location box:
The top measure and location, or a specific measure and location
The selected period, a computed period, or a specific period
The selected comparison series, or a specific comparison series
The font, color, and shape of the box
The display contents of the box
By default, a measure and location box displays text and performance indicator colors that are defined for the database. Before specifying a personalized font or background color for a measure and location box, override the database settings by deselecting Show measure and location performance colors in View Options.
Additionally, you can hide measure and location information to create a performance dot, which resembles a traffic light, to the map to align performance with background images. For example, use a country map as a map background, and add performance dots to the map to represent the performance of cities.
How to add a measure and location box to a map
You can choose a measure and location for an individual measure and location box. The Measure or Location list can be unavailable, depending on the choices made in Map Contents in Setup➛Maps. You can also create a box attachment, such as a briefing book or view.
1 Choose Add Measure and Location Box.
2 Click on the map to add the measure and location box.
3 Double-click the measure and location box.
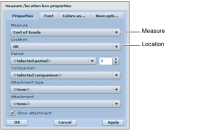
4 In Measure and location box properties, choose a top measure and top location, as shown in Figure 4‑28.
Figure 4‑28 Choosing a measure and a location
5 To add a link to an object such as a briefing book or view:
1 Select a type of object from the Attachment type list.
2 Select an object from the Attachment list.
3 Select Show attachment to show the link in the box. If the link is longer than the measure and location box, deselect Show attachment to hide the link. A map user opens a hidden link by right-clicking to open the menu.
6 Choose Apply.
How to define a comparison series or period for a measure and location box
You can create a specific period or a computed period for a measure and location box. A specific period is static and does not change when a user changes the period in a map. A computed period is the selected period in the map plus or minus a value that you specify. For example, if the computed period is defined as –1, and the selected period is February 2011, the computed period is January 2011.
You can use specific or computed periods to show trends from one period to another on one map. For example, create multiple measure and location boxes with the same measure, but with differing periods to show trends in sales.
You can also define a specific comparison series for a measure and location box. The comparison series does not change when a user changes the comparison series in a map. Choose a specific comparison series to show measures and locations with different comparatives, for example Actual vs. Target and Actual vs. Last Year for the same measure, on one map.
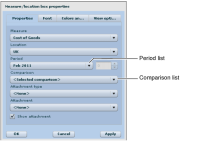
1 To assign a specific period to this measure and location, select a period from the Period list, as shown in Figure 4‑29.
Figure 4‑29 Choosing February 2011 as the selected period
2 To assign a computed period to this measure and location, select a period from the Period list, and provide a numeric value, as shown in Figure 4‑30.
Figure 4‑30 Choosing a computed period of the selected period minus one
3 To assign a specific comparison series for a measure and location, select a comparison series from the Comparison list.
4 Choose Apply.
How to specify font settings for a measure and location box
1 In Measure and location box properties, choose View options. Deselect Show measure and location performance colors.
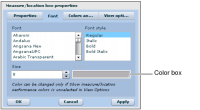
2 In Measure and location box properties, choose Font.
3 Select a font, font style, and font size, as shown in Figure 4‑31.
Figure 4‑31 Specifying the font for a measure and location box
4 To choose a font color, choose the color box and select a color from the palette.
5 Choose Apply.
How to specify color and shape of a measure and location box
You can define the color, shape, border, relative positioning, and size of a measure and location box.
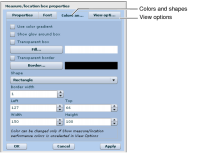
1 In Measure and location box properties, choose Colors and Shapes, as shown in Figure 4‑32.
Figure 4‑32 Specifying the appearance of a measure and location box
2 To apply a drop shadow to the box, select Show glow around box.
3 To make the box background transparent, select Transparent box. To make the box border transparent, select Transparent border.
4 To define a background color for the box, perform the following tasks:
1 Choose View options. Deselect Show measure and location performance colors.
2 Choose Fill.
3 In Select color, select All colors, Shades of gray, or Standard Metrics Management index range colors.
4 Choose the color box, and select a color from the palette, as shown in Figure 4‑33. Then, choose OK.
Figure 4‑33 Specifying the color of a measure and location box
5 To apply a gradient to the color, select Use color gradient.
6 Choose OK.
5 To define a border color for the box, perform the following tasks:
1 Choose Border.
2 In Select color, select All colors, Shades of gray, or Standard Metrics Management index range colors.
3 Choose the color box and select a color from the palette.
4 Choose OK.
6 To change the box shape, select a shape from the Shape list.
7 To change the width of the box border, change the value in Border width.
8 To adjust the position of the box relative to the top left of the map, provide values in Left and Top.
9 To adjust the size of the box, provide values in Width and Height.
10 Choose Apply.
How to specify the display contents of a measure and location box
You can specify what to display in a measure and location box, such as the measure name, and the base and comparison series.
1 In Measure and location box properties, choose View options, as shown in Figure 4‑34.
Figure 4‑34 Selecting information to appear in a measure and location box
2 To specify display options for the measure and location box, perform any of the following tasks:
To display the measure’s name, select Show measure name.
To display the location’s name, select Show location name.
To display the period, select Show period name.
To display the measure and location’s performance color as the box background color, select Show measure and location performance colors.
To display colored arrows that indicate the performance of the worst performing submeasure and sublocation in the view structure, select Show measure and location performance indicators. Performance indicators do not display in generated maps if the measure or location is the lowest in the view branch.
3 To show measure and location information in the box, select Show information, and then perform any of the following tasks:
To display the measure’s base data value, select Show base data.
To display the measure’s comparison data value, select Show comparison data.
To display the measure’s index value, select Show index.
To display a text representation of the measure’s index value, select Show index range identifier.
To display the variance for a data or formula measure, select Show variance.
To display the percentage variance for a data or formula measure, select Show variance.
To display the measure owner, select Show owner.
4 Choose OK.
How to create a performance dot
1 Add a measure and location box to the map.
2 Double-click the measure and location box.
3 In Measure and location box properties, choose Colors and Shapes, and select Circle from the Shape list.
4 Choose View options, and deselect all check boxes, except Show measure and location performance colors.
5 Choose OK.
6 Resize the measure and location box.
Creating a text box
Add the text box to the map, and define the text box properties, such as font and font size, and text box background color.
Optionally, create a link to a Metrics Management object, for example a book or view. Consider creating a hidden link if the attached object’s name is longer than the text box. A map user opens a hidden link by right-clicking and selecting Launch link from the shortcut menu.
How to add a text box to a map
1 Choose Add Text Box.
2 Click a location on a map where you want a text box to appear.
3 Double-click the box.
4 In Text box properties, type text that will appear in the text box.
5 To define text alignment, in Text Alignment, choose Left, Center, or Right, as shown in Figure 4‑35.
Figure 4‑35 Specifying text appearance in a text box
6 To add a link to a Metrics Management object, perform the following tasks:
1 Select a type of object from the Attachment type list.
2 Select an object from the Attachment list.
3 To show attachment as a link, select Show attachment. The link displays the object’s name in the map. To create a hidden link, deselect Show attachment.
How to specify font settings for a text box
1 To specify font settings for a text box, choose Font.
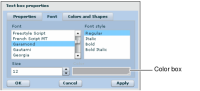
2 Select a font, font style, and font size, as shown in Figure 4‑36.
Figure 4‑36 Specifying the font for a text box
3 To choose a font color, choose the color box and select a color from the palette.
4 Choose Apply.
How to specify color and shape of a text box
1 To define the color and shape properties of the text box, choose Colors and shapes, as shown in Figure 4‑37.
Figure 4‑37 Specifying the appearance of a text box
2 To apply a drop shadow to the box, select Show glow around box.
3 To make the box background transparent, select Transparent box. To make the box border transparent, select Transparent border.
4 To define a background color for the box, perform the following tasks:
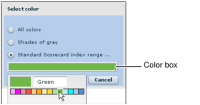
1 Choose Fill.
2 In Select color, select All colors, Shades of gray, or Standard Metrics Management index range colors.
3 Choose the color box, and select a color from the palette, as shown in Figure 4‑38. Then, choose OK.
Figure 4‑38 Specifying the color of a text box
4 To apply a gradient to the color, select Use color gradient.
5 Choose OK.
5 To define a border color for the box, perform the following tasks:
1 Choose Border.
2 In Select color, select All colors, Shades of gray, or Standard Metrics Management index range colors.
3 Choose the color box, and select a color from the palette.
4 Choose OK.
6 To change the box shape, select a shape from the Shape list.
7 To change the width of the box border, change the value in Border width.
8 To adjust the position of the box relative to the top left of the map, provide values in Left and Top.
9 To adjust the size of the box, provide values in Width and Height.
10 Choose Apply, then choose OK.
Specifying the default measure and location or text box selection
Metrics Management supports specifying which measure and location or text box is selected when a map opens. Consider specifying a default measure and location box to ensure that the map does not show a blank dashboard when opened.
How to specify the default measure and location or text box
Right-click a measure and location or text box and select Set as default node, as shown in Figure 4‑39.
Figure 4‑39 Choosing to define the default measure and location box
How to locate the default measure and location or text box
To locate the default measure and location or text box, right-click the map and select Go to default node, as shown in Figure 4‑40. To specify no default node, choose Clear default node.
Figure 4‑40 Locating the default measure and location box
Adding a line to a map
You can add a line to a map and define properties for it. You can change the position of a line on the map, change the line width, style, and color, and add or remove arrows from a line.
How to add a line to a map
1 Select one of the following line shapes:
To create a straight line segment, choose Add straight line.
To create a curved line segment, choose Add curved line.
2 Click the map to add the line.
3 To set properties of a line segment, double-click the selected line segment.
4 In Line properties, shown in Figure 4‑41, perform any of the following tasks:
Figure 4‑41 The line properties dialog box
To adjust the position of the line relative to the top left of the map, provide values in Left and Top.
To change the width of the line, provide a value in Line width.
To add an arrow to the line, select Arrow at start or Arrow at end.
To change the style of the line, select a style from the Line style list. Line styles are not available for curved lines.
To change the color of the line:
1 Choose Color.
2 In Select Color, select All colors, Shades of gray, or Standard Metrics Management index range colors.
3 Choose the color box, and select a color from the palette.
4 Choose OK.
5 Choose OK.
How to connect a line to a map object
You can precisely connect a line to a map object.
1 Select the line to connect to a map object.
2 Move the mouse cursor over one end of the line until the cursor turns into cross hairs, as shown in Figure 4‑42.
Figure 4‑42 Selecting a line
3 Click and drag the end of the line toward the box until a purple outline appears around the box, as shown in Figure 4‑43.
Figure 4‑43 Dragging a line towards a box
4 Release the line. The end of the line connects to the edge of the box.
How to change point coordinates in a line
To change the position of the line on the map by adjusting each point individually, choose Points and change the X and Y value for each point you want to change.
At the bottom of the Map Designer, the X and Y values show the position of the cursor, where X=0 at the left of the page and Y=0 at the top of the page. As you move the cursor to the right, the value of X increases, and as you move down, the value of Y increases.
How to add a joint to a line
You can use a joint to angle a straight line or to add another curve to a curve line.
1 Choose Add Joint.
2 Move the cursor over the place on the line on which to add the joint.
When the cursor turns red, select the line, as shown in Figure 4‑44. The joint is added to the line.
Figure 4‑44 Adding a joint to a line
3 To change the angle between two joint-line segments, select the joint and drag it to a new location, as shown in Figure 4‑45.
Figure 4‑45 Creating an angle in a line
How to remove a joint in a line
1 Choose Remove Joint.
2 Select the line from which to remove a joint.
3 Move the cursor over the joint to remove.
4 When the curser turns red, choose the joint, as shown in Figure 4‑46.
Figure 4‑46 Removing a joint
The joint is removed from the line.
Aligning map objects to the grid
You can use snap to grid to align measure and location boxes, text boxes, and lines to a grid on the map. You can show or hide the grid and change the grid size. Boxes and lines snap to the grid as follows:
The top-left corner of a box snaps to the closest grid-line intersection.
The left end-point of a straight line snaps to the closest grid-line intersection.
The top-left corner of a rectangle that would enclose an entire curved line snaps to the closest grid-line intersection.
New map objects do not align to the grid until you choose Snap to Grid.
You can also show the X and Y coordinates, width, and height for an object on the map, such as a measure and location box or a line.
How to show or hide the grid
Right-click the map and choose Show snap grid, as shown in Figure 4‑47, or Hide snap grid.
Figure 4‑47 Choosing to show the map grid
How to change the size of the grid
In the bottom toolbar, provide a value in Snap distance to increase or decrease the pixel size between lines in the grid. You can enter a pixel value between 0 and 99. Decrease the pixel value to align boxes and lines with a high degree of precision.
How to align map objects to the grid
Choose Snap to Grid. All objects on the map align to the grid. To align a new map object to the grid, choose Snap to Grid again.
How to show an object’s X and Y coordinates on a map
1 In the Map Designer, select an object, for example a measure and location box.
2 Right-click and choose Show hints, as shown in Figure 4‑48.
Figure 4‑48 Choosing to show map hints
3 In Figure 4‑49, the hint box displays the X and Y coordinates, width, and height for a measure and location box.
Figure 4‑49 Showing hints for a measure location pair