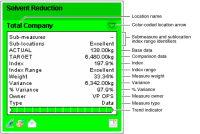
You specify the information that appears in measure and location boxes by choosing options from the Configure view tree display menu. For example, you can show the measure and location’s index value, weight, variance, and owner for all boxes in a view. Figure 2‑21 shows the Solvent Reduction measure with all available display options enabled. A measure arrow and submeasure index range identifier do not appear because Solvent Reduction is the lowest measure in the branch.
Figure 2‑21 Measure and location information for the Solvent Reduction measure
You can select the following display options for measure and location boxes:
Show Base Data
Displays a measure’s base data value.
Show Comparison Data
Displays a measure’s comparison data value for the selected comparison.
Show Hints
Displays measure and location information as a tooltip when a user moves the mouse pointer over a measure and location box.
Show Index
Displays a measure’s index value.
Show Index Range Identifier
Displays a text representation of a measure’s index value.
Show Location
Displays the location name below the measure name.
Show Location Arrow Colors
Displays color-coding in location arrows. Color‑coding indicates the performance of the worst-performing sublocation in a view branch.
Show Measure Arrow Colors
Displays color-coding in measure arrows. Color‑coding indicates the performance of the worst-performing submeasure in a view branch.
Show Owner
Displays a measure’s owner.
Show Submeasure and Sublocation Index Range Identifiers
Displays a text representation of the worst-performing submeasure and sublocation in a view branch.
Show Summary Bar
Displays measure and location information in a bar at the bottom of the view for the selected measure and location box.
Show Trend Indicator
Displays previous performance information in bars in a color-coded trend indicator arrow.
Show Trend Indicator Hints
Displays tooltips for a period in the trend indicator when a user moves the mouse pointer over a measure and location box. The tooltip displays the period date, index value, and index range identifier.
Show Type
Displays the measure type.
Show Variance
Displays a data or formula measure’s variance, which is the difference between the measure’s actual and comparative values.
Show % Variance
Displays a data or formula measure’s percentage variance, which is the variance as a percentage of the comparative.