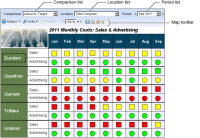
A map, shown in Figure 2‑28, is an interactive, visual representation of performance measures. The following sections describe how to open and use measures and locations in a map.
Figure 2‑28 Sales and Advertising map
A map contains the following elements:
Comparison list
Contains a selection which defines the base and comparison series for measure and location boxes
Location list
Contains a selection which defines the location for measure and location boxes
Period list
Contains a selection which defines the display period for measure and location boxes
If your map boxes are based on measures, you can use the Location list to change the location for all measures in the map. If your map boxes are based on locations, use the Measure list to change the measure for all locations in the map. If your map boxes are based on measures and locations, the Map window displays only the Comparison and Period lists.