Metrics Management displays start date, end date, budget performance, and rating performance indicators. Metrics Management also displays the progress of an initiative as a percentage. Figure 2‑34 shows the Overview section of the Initiatives dashboard tab for the Customers measure. An initiative displays performance information depending on the selected comparison series.
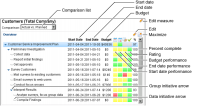
Figure 2‑34 Overview section in the Initiatives tab of a dashboard
The Overview section contains the following values and performance indicators for initiatives:
Comparison list
Defines the base and comparison series used to calculate data for the start date, end date, and budget performance indicators. Select from the Actual vs. Planned, Actual vs. Forecast, and Forecast vs. Planned comparison series.
Start date
Displays the initiative start date for the base series.
End date
Displays the initiative end date for the base series.
Budget
Displays the budget value for the base series.
Start date performance
Indicates the performance of the start date.
End date performance
Indicates the performance of the end date.
Budget performance
Indicates the performance of the budget value.
Rating
Represents a qualitative evaluation of the initiative by the initiative owner.
Percentage complete
Represents an evaluation of initiative’s progress by the initiative owner.
Group initiative arrow
Indicates that the initiative is a group initiative.
Data initiative arrow
Indicates that the initiative is a data initiative.
How to view a text representation of a performance indicator
To view a text representation of an initiative’s performance indicator, hover the mouse over a performance indicator for an initiative. Performance data appears as a tooltip, as shown in Figure 2‑35.
Figure 2‑35 Showing the text representation of start date performance
How to change the comparison series
From the comparison list, select Actual vs. Planned, Actual vs. Forecast, or Forecast vs. Planned.