You can enter data manually in the dashboard for a measure or location selected in a book or view. The polarity indicator arrow in the top row of the data table indicates whether to consider high values good or bad.
How to enter data in the dashboard
1 Open a view or briefing book. If opening a view, choose Show dashboard in the toolbar.
2 Select a measure and location by drilling down.
3 Use the Period box arrows in the top-right corner of the view or briefing book to select the period for the data.
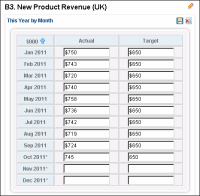
4 In the dashboard, choose Direct Data Entry.
5 Enter data into the Actual and Target boxes for the appropriate periods, as shown in the example in Figure 3‑2.