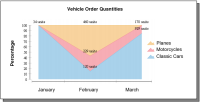
An area chart that includes several series displays overlapping filled areas. A percent stacked area chart can show how percentages compare over time. For example, the area chart in
Figure 19‑1 shows the percentage of order unit volume that each product group contributes to total order volume for a three‑month period.