A bar chart displays data values as a set of vertical columns. Optionally, flip the axes to display two series using horizontal bars, as shown in Figure 19‑2.
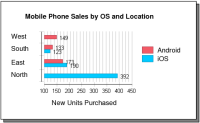
Figure 19‑2 Bar chart using horizontal bars
Flipping the axes changes layout of the information such that the eye can easily compare the value differences between two types of information. Use a bar chart to show data changes over a period of time or to illustrate comparisons among items. Like an area chart, stacked and percent stacked bar charts can also show the relationship of individual items to a whole.