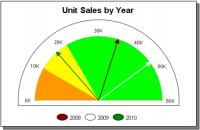
A meter chart uses a needle to point to values on a circular or semicircular dial. You use a meter chart to create a gauge or dashboard display. To emphasize settings on the dial, divide the meter background into sections called dial regions. Adjust the dial settings in the same way as you adjust an axis, resulting in many options for arranging and emphasizing the dial data. Figure 19‑5 shows a meter chart that contrasts the yearly sales of a product.
Figure 19‑5 Meter chart
A meter chart is best used to emphasize a small number of values.