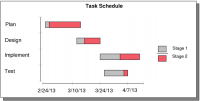
A Gantt chart graphically presents project scheduling information by displaying the duration of tasks. One axis shows the time series. The opposite axis shows tasks.
Figure 19‑11 uses color-coded bars to show the planned duration of the stages scheduled to complete each task. As described in the chart legend, the bars use different colors to differentiate Stage 1 and Stage 2.