The tutorial that you just completed introduced the chart builder. As you saw in the tutorial, the chart builder has the following main pages:
Select Chart Type
In this page, you determine the type of chart and basic structural attributes such as orientation and the dimension of the chart.
Select Data
In this page, you specify the data that the chart displays.
Format Chart
In this page, you modify the appearance of the data that the chart displays, such as the range of values an axis displays, or the visual elements of the chart, such as the color of the lines in a line chart.
You access these pages by choosing the buttons at the top. You then complete the mandatory tasks, as well as some tasks that are optional, such as formatting the labels. This section describes the chart builder pages.
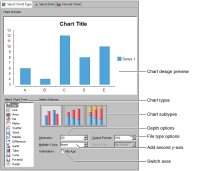
The most common task that you complete on Select Chart Type is selecting a chart type and subtype, as you did in the tutorial. You can also use Select Chart Type to modify the subtype you choose. You can show some charts in two dimensions, two dimensions with depth, or three dimensions, and you can flip the axes of some charts to a horizontal position. Select Chart Type is also where you can determine the output format of the chart. Figure 19‑35 shows the options that appear on Select Chart Type.
Figure 19‑35 Selecting chart type and subtype
Creating a chart with depth or three dimensions
All chart types offer two-dimensional rendering in which the chart shape appears flat against the chart background. Some BIRT charts have subtypes with depth, which use three-dimensional effects to create the appearance of depth. Finally, some charts have three-dimensional subtypes, which arrange multiple series elements along a third axis in addition to the typical x- and y‑axes. You select the chart type, dimension, and subtype in Select Chart Type, as shown in Figure 19‑35.
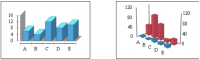
Figure 19‑36 shows the difference between a bar chart with depth and a three‑dimensional bar chart. In the first chart, the bars have the appearance of three-dimensional objects, and multiple series appear side by side on the x‑axis. Three-dimensional charts display multiple series from front to back, as shown in the second chart in Figure 19‑36.
Figure 19‑36 Depth and three-dimensional bar charts
Table 19‑1 lists the dimension options available for each chart type.
Table 19‑1 Dimension options for chart types
Chart type
Dimension options
2D
2D with Depth
3D
Area
✓
3
3
Bar
✓
3
3
Bubble
✓
–
–
Cone
✓
3
3
Difference
✓
–
–
Gantt
✓
–
–
Line
✓
3
3
Meter
✓
–
–
Pie
✓
3
–
Pyramid
✓
3
3
Scatter
✓
–
–
Stock
✓
–
–
Tube
✓
3
3
Using chart subtypes
In the chart builder, choosing a chart type and dimension displays any available subtypes. For example, bubble, difference, Gantt, and scatter charts do not have subtypes. Area, bar, cone, pyramid, tube, and line charts have the following subtypes:
Either overlay or side-by-side
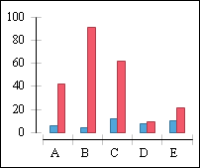
A side-by-side bar, cone, pyramid, or tube chart arranges risers that represent each series beside one another, as shown in Figure 19‑37. The number of series determines the width of the riser.
Figure 19‑37 Side-by-side subtype for a two-dimensional bar chart
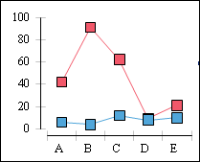
An overlay line or area chart arranges lines or areas that represent each series independently, one over another, as shown in Figure 19‑38.
Figure 19‑38 Overlay subtype for a two-dimensional line chart
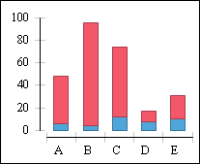
Stacked
A stacked chart arranges the data points from one series on top of the data points of another series, as shown in Figure 19‑39.
Figure 19‑39 Stacked subtype for a two-dimensional bar chart
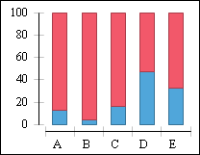
Percent stacked
A percent stacked chart is similar to a stacked chart, except the total of the data points in a category fills the entire plot area for a category, as shown in Figure 19‑40. The value of each data point is a percentage of the total of all data points for that category.
Figure 19‑40 Percent stacked subtype for a two-dimensional bar chart
Understanding chart output formats
There are four output formats available: BMP, JPEG, PNG, and SVG. By default, the chart builder creates a chart in SVG format. SVG is a vector‑graphics markup language that describes two-dimensional graphics in XML. SVG enables report developers to include more accessible, searchable, and interactive images in their reports. For example, the legend interactive features that BIRT charts include use the SVG format to enable highlighting and hiding series data.
SVG files are typically smaller than image files in other formats and produce high-resolution images. For example, if your chart uses a photograph as a background image, you will likely want to use JPEG or PNG format, because those formats display photographic images particularly well. Almost all modern web browsers, including mobile device browsers, provide support for SVG images. Internet Explorer added native support for SVG in version 9, but earlier versions require a plug-in to support SVG. You must use the SVG format if you want your chart to be interactive.
The following procedure explains how to change the chart output format.
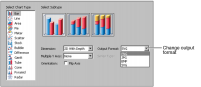
How to change the chart output format
1 In the chart builder, choose Select Chart Type.
2 In Output Format, select an option, such as PNG or BMP, as shown in Figure 19‑41. Choose Finish.
Figure 19‑41 Output format option on Select Chart Type