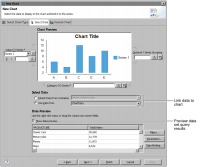
Use the chart builder to link a data set to a chart and plot the data. Choose Select Data, then select one of the following options to link data to a chart, as shown in Figure 20‑1:
Inherit Data from Container
Retrieves data from the data set that is bound to the container, such as a grid or table in which the chart appears.
Use Data from
Retrieves data from a data set, a cube, or another report item’s result set.
Figure 20‑1 Select Data page of the chart builder
After linking data to the chart, Data Preview displays actual data. If you select Show data preview, you see column headings and up to six rows of data by default. To reduce the previewing time, deselect Show data preview. You then see column headings only. Inspect the data preview to verify that the data meets your needs. You can exclude values by filtering data or by using a parameter to return only certain data.
As described later in this chapter, you can drag and drop data columns from Data Preview to the upper half of the Select Data page to plot the data. For example, use this technique to specify which axis of a bar chart uses which column of data.
If there is no data available then you can select a message to appear in its place. In Format Chart, select Chart Area➛Chart Visibility and accept the default message or enter appropriate text, as shown in Figure 18-2.
Figure 20‑2 Empty chart message
Linking to data from a container
To inherit data from a container, first place a chart element in the cell of a table or list. In Inherit Data from Container, select one of the following options:
Inherit Columns and Groups
Inherit Columns
Selecting data inherited from the report container ensures integration of the chart with the report. For example, the chart changes when the table that contains it receives updates.
Linking to data from a data set, data cube, or report item
Generally, you define a data set or data cube using Data Explorer before you start building a chart. Performing these tasks in Data Explorer is a best practice because it gives you optimal control and performance. After setting up the data, open the chart builder and select the chart type, as you did in the tutorial in Using a chart. Now you are ready to link data to the chart.
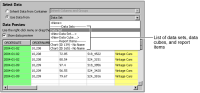
To use data from an existing data set, data cube, or report item, place a chart element anywhere in a report, and select Use Data from. Select from the list, as shown in Figure 20‑3.
Figure 20‑3 Using data from a data set, cube, or report item
If existing data sets and data cubes do not supply the data values that you need, and you do not want to exit the chart builder and start over, select the option to create a new data set or data cube. Use any of the existing data sources connected to your report.