Exceptions are one of the most evident symptoms of execution errors. You can set breakpoints on certain exception classes when an exception occurs. Exception breakpoints stop execution whenever an exception of a selected type is thrown. This functionality is directly inherited from the JDT debugger and has the same capabilities. When a selected exception occurs, the report engine stops execution, and the report item instance and variable values can be examined in the current context.
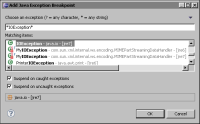
Exception breakpoints can be viewed, enabled, or disabled using the standard Breakpoints view. Choosing Add Java Exception Breakpoint from the Breakpoints view activates these breakpoints, as shown in Figure 41‑12. Alternatively, add a Java exception breakpoint by choosing Run➛Add Java Exception Breakpoint.
Figure 41‑12 Selecting an exception breakpoint
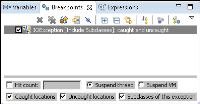
Execution can be stopped when a thrown exception is either caught or uncaught, or both. The breakpoint appears in the Breakpoints view as shown in Figure 41‑13. Enable or disable these breakpoints using the context menus in the Breakpoints view, the Java editor ruler, and the script editor ruler.
Figure 41‑13 Viewing a breakpoint in Breakpoints view
Using exception breakpoint debugging can be very helpful when you work on complex reports. For example, if a column in a report has an invalid data type, every time the report is run, the report engine throws a DataException. If the report uses multiple data sets or libraries, the exact column definition is not easy to find. In that situation, add a breakpoint exception for DataException and debug the report. When the DataException occurs again, the debugger stops the execution at the specific breakpoint. Inspect the current report context in the Variables view to identify the data set and the library names. Knowing the data set makes locating and correcting the column definition to fix the error into a straightforward task.