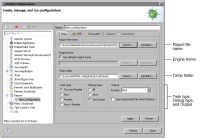
Use the standard Eclipse debug launch configuration interface to start the report debugger. Set specific report debugger options on the configuration page. Ideally, use only one launch configuration type for both report and code debugging. To run a report in the Debug perspective, create a Report debug configuration by choosing Run➛Debug Configurations. Figure 41‑14 shows the Main page, which contains the key configuration settings for the Report debug configuration type.
Figure 41‑14 Settings for a Report debug configuration
In Main, configure the following settings:
Name
The name of the debug configuration. Good practice is to use the report name as the configuration name to aid in distinguishing among multiple configurations.
Report file name
The path to the report file to debug. Debugging either a report design or a report document is available, depending on the task type.
Engine home
The BIRT Report Engine home path. By default, BIRT uses the same engine that starts the debugger. Specify an external engine home to test the report using a different version of BIRT run‑time libraries. The external report engine home typically points to a BIRT run-time folder, for example, C:\birt-runtime-4_3_1\ReportEngine.
Temp folder
The temporary working folder for the report debugging process. By default, this folder is the system temp folder.
Task type
The engine task type to use for the debug process. Table 41‑2 lists and describes the available types.
Table 41‑2 Engine task types for debugging a report
Task type
Report engine action
Run and Render
Processes the report. The engine does not generate a report document file. The engine renders the design file directly to a target output format.
Run
Generates only a report document. The engine does not render the document to a target output format.
Render
Renders a report document file to a target output.
Run + Render
First, generates a report document using a Run task. Then, the engine renders the document to a target output format using a Render task.
Debug type
The available types of debugging: All, Java, or JavaScript.
Output
The available output format types for the debug process: DOC, HTML, PDF, PostScript, PPT, or XLS.
To open the generated output file when the debug process completes, select Open generated file when finished.
Launching the debug configuration establishes a connection between the debugger and the running report. You can then use breakpoints, stepping, or expression evaluation to debug your program.
How to create a debug configuration
The following section shows how to create a launch configuration to debug a BIRT report. The report name is ProductsByProductLineDBG.rptdesign.
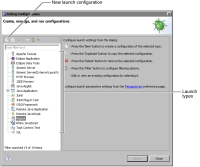
3 From the list of launch types, select Report. Then, choose New launch configuration, as shown in Figure 41‑15.
Figure 41‑15 Selecting New launch configuration
Debug Configurations creates a default report launch configuration named New_configuration, as shown in Figure 41‑14.
4 In Name, type the name of the report to debug. By default, a new configuration uses the currently opened report as the file to debug. Change the name and other debug settings as required. For example, in Output, select the output format for the report.
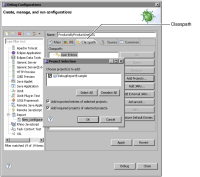
5 If you are debugging a Java event handler, set the Java Classpath to ensure the report engine can find the event handler class. Choose Classpath, as shown in Figure 41‑16. In Classpath, choose Add Projects, Add JARs, or Add External JARs, according to the location of the eventhandlers.jar file.
6 Choose Apply to create the report debug configuration.
Figure 41‑16 Setting the classpath to Java event handlers in a project