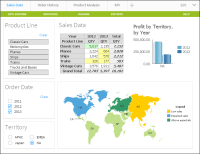
A dashboard is a self-contained web application which delivers business performance data in interactive charts, cross tab tables, BIRT documents and external web services. Dashboards are quickly built using gadgets that display data driven visualizations, files, or enable user choices. These gadgets can link together to display data related to user requests, as shown in Figure 5‑1.
Figure 5‑1 Displaying a sample dashboard layout
When you build a dashboard you add gadgets to one or more tab pages of a dashboard, similar to web pages. You choose the content to display in each gadget and users of the dashboard can interact with that content, such as a chart or table of data. The following gadget types are available:
Report gadgets display BIRT content such as BIRT documents, libraries, and user input parameters from BIRT documents.
Chart gadgets organize and display data using symbols such as bars and lines.
Table gadgets display data values in cross tabs and in a row and column format.
Data selector gadgets show values for users to query data in other gadgets.
Extras gadgets display external content such as web applications, video, HTML, JavaScript code, and Google gadgets.
You can create dashboards using the BIRT Designer Professional desktop application. Finished dashboards are deployed to a BIRT iHub or cloud server, such as BIRT onDemand and available to users in the following formats:
A dashboard file in Visualization Platform
A URL address when deployed as a BIRT application
A web page using Actuate JavaScript API (JSAPI) to embed the dashboard
Users can then interact with, export, or print data displayed in existing dashboards or include your published dashboard as a page in their own dashboard file when using Visualization Platform.