A library is a key tool for achieving consistent appearance in a suite of report designs. To use libraries effectively, consider how to make the best use of their properties and functionality. Although you can use one library containing every custom component that all of your report designs need, this library would be large and confusing for other report developers.
One way to design a suite of libraries is first, make libraries containing elements common to all reporting projects. Second, for each reporting project, create a project-specific library. These project-specific libraries can contain elements that are simple modifications of the standard report elements and complex elements, such as tables nested within grids or lists.
A library can refer to items in other libraries. For example, if a project library contains a grid for a report header that uses the company logo, you can include the logo from the general library in that grid.
For example, create the following libraries:
A general library containing standard items that all projects use, such as themes, an image element for the company logo, and master pages, including standard page headers and footers
A library containing complex items that all projects use, for example, a table element with predefined behavior, such as highlighting
One or more libraries containing elements specific to each project, such as data sources
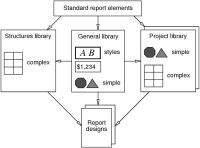
By building suites of libraries in this way, you provide the building blocks for a standard appearance for all reports, and package the behavior and appearance of report elements appropriate to each reporting project. Figure 28‑8 shows an architecture for libraries and report designs.
Figure 28‑8 Project architecture using libraries
Designing a general library
A general library contains standard, simple items, such as a company logo image element or a text element that contains a confidentiality agreement. This library also contains a default theme that includes settings for predefined styles and any custom styles for all report designs. If multiple reporting projects need to use a different theme, place that theme in this library. You can also include common items, such as master pages that use the other basic components in the library.
Designing a structures library
A structures library provides grids, lists, and tables to report designs. For example, most report designs use a table element. Initially, the table element in a structures library is identical in behavior to the table from the palette. Later, a need arises to alternate the row colors for every table in every report design. Make the change to the tables in the library and every report design that uses the table from the library now has the new feature. If the structures library did not contain table elements, report developers would have to make this change manually in every design.
Designing structure elements
When a report developer uses an item from a library in a report design, he can change any properties, but not the item’s structure. For example, if the developer uses a table from a library, BIRT allows changes to the table’s style or data binding, but not adding or removing cell contents, columns, or groups. A library structure has the maximum number of columns, rows, and groups available to a report design. To reduce the number of visible columns in a report, a report developer sets the width of a column to zero.
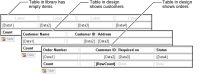
Figure 28‑9 is an example of this approach. The table in the library has four columns. Cells in the header row contain labels, cells in the detail row contain data elements, and cells in the footer row contain a label and data elements. A report design uses two copies of the library table. One copy modifies the cell contents to show a list of customers in three columns and sets the width of the empty fourth column to zero. The other copy uses all four columns to display order information.
Figure 28‑9 Customizing a table from a library
The developer of grid, list, and table elements in a library must consider the contents of the cells as well as the layout and behavior of the element itself. The recommended practice is to place a report item in every cell in a grid, list, or table defined in a library. By changing the properties of the labels or data items after placing the element in a report design, report developers use the same structure to achieve many different results.
Designing data binding for library table elements
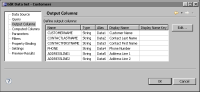
Designing the data binding at the same time as developing a table element in a library reduces the steps required to use the element in a report design. The most important task in the design process is to decide on a naming convention for columns in a data set. Both library and report developers must use this convention to set the alias of each column. For example, in the data set editor shown in Figure 28‑10, each column in the data set has an alias that begins with Data. Each alias has a numeric suffix.
Figure 28‑10 Standardized aliases for output columns in a data set
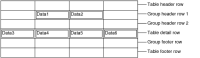
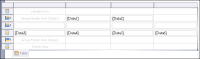
The library developer determines the desired structure for the table. For example, the diagram in Figure 28‑11 shows a four-column table having a single grouping level. The table uses two data items in the first group header row and four data items in the detail row.
Figure 28‑11 Layout of data items bound to fields in a library table
The library developer uses a dummy data set to prepare the data binding for the table. This data set has the same number of columns as data items required in the table. For example, the following query on the Customers table in the Classic Models, Inc. sample database provides the six columns required for the table in Figure 28‑11:
Using the data set editor, define aliases conforming to the naming convention for the columns, as shown in Figure 28‑10.
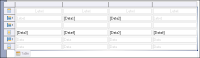
The library developer creates a table having the desired number of columns, rows, and groups. Next, he drags data fields from the data explorer into the desired cells in the table. This action binds the dummy data set to the table and uses the column aliases to assign the column bindings to the data items. BIRT also creates label items as column headings for each data item. Figure 28‑12 shows the appearance of a table having the structure shown in Figure 28‑11, and data items using the names shown in Figure 28‑10 in the layout editor.
Figure 28‑12 Library table containing data items and empty labels
The library developer removes the binding for the dummy data set from the table. To retain the data bindings used by the data items, do not clear the existing data field information when prompted. This data field information contains the standard names for data columns.
The library developer completes the structure of the table by adding report items to the remaining empty cells, for example, label items for additional column and row headings, and data items to contain aggregations for column totals. The developer does not provide bindings for the aggregation data items. The library table stores only bindings for data fields. The report developer must provide bindings for aggregations.
The library table is now ready for publishing to a library in the resource folder and for use in a report design.
How to set up a library table to use standardized data binding
1 Open or create a library.
2 Create a table having the desired number of columns, rows, and groups.
3 Create a data source of any type. For example, create a data source using the Classic Models, Inc. sample database.
4 Create a data set using the data source. Define a query to provide the number of data fields required by the table.
5 In Edit Data Set, in Output Columns, edit each column. In Edit Column, type a standardized alias and use the same value for Display Name.
6 Set up the data structure of the table. After completing this step, a table matching the diagram in Figure 28‑11 looks like Figure 28‑12.
1 In the Outline view, expand the Report Items node and select the table.
2 From Data Explorer, drag columns from the data set into table cells.
3 Move or delete the labels that appear in the group header row, as required. Delete the text from the labels.
4 Select the table again. In Property Editor, select Groups. In Groups, select the group. Choose Edit. In Edit Group, in Group on, select a field. Then, choose OK. If a new data item that you do not need appears in the group header, delete the item.
7 Using the palette, add labels to the remaining header cells and data items to contain aggregations to the footer cells. For each data item, in New Data Binding, choose Cancel. A table matching the diagram in Figure 28‑11 now looks similar to the one in Figure 28‑13.
Figure 28‑13 Library table containing all required items
8 Optionally, rename the labels and data items to have meaningful names.
9 Remove the temporary data elements from the library.
1 Select the table.
2 In Property Editor, select Binding. In Data Set, select None. To retain the data field information for the table, in Change Data Set, choose No.
3 In Data Explorer, delete the data set and data source.
10 Save and publish the library. Choose File➛Save. Choose File➛Place Library in Resource Folder.
Defining a project library
The purpose of a project library is to provide customized report elements for report designs within a single reporting project. The most common elements specific to a project are data sources. Other simple elements contained in a project library are project-specific image elements and text elements having standard wording and formatting. A project library can also contain complex, structured elements, such as tables that have custom layout or behavior.
A project library can include data sets, but for best report generation speed, a report design should use a data set developed for its specific needs. A data set from a library is often too general for optimum efficiency because it retrieves more fields from a data source than most report designs require.
There are two ways to set up a project library.
Customizing every type of report element
Report developers use only this library in every new report design for the project. Instead of using report items directly from the palette or the general libraries, they use report items from the project library. Use this technique if the project customizes many elements or if the project’s requirements are likely to change frequently.
Customizing only the project-specific report elements
Report developers use this library and the general libraries in every new report design for this project. They use the report items from the project library or from the palette. Use this technique if the project customizes only a few elements or provides only complex structures to complement the elements from the palette.