Tutorial 3: Debugging a report that contains Java and JavaScript code
This tutorial provides step by step instructions about how to debug a report that contains Java and JavaScript event handlers. The report example in this tutorial uses the Classic Models, Inc. sample database and displays the car sales, grouping the data by country and customer. Additional analysis in the report highlights the orders having prices above the median price in fuchsia and the orders having prices below the median price in yellow. The orders for the product line selected by the user appear in bold font. The report uses a JavaScript event handler to implement the highlighting and a Java event handler to set the bold font for certain rows.
Compiling the Java event handler class requires the org.eclipse.birt.runtime_<version>.jar file to be in the build classpath. This library is provided in the BIRT run‑time package. Download the BIRT Report Engine run‑time archive (.zip) file, birt-runtime-4_3_1.zip, from the Eclipse BIRT website. Unzip the file in your environment.
To prepare to perform this tutorial, download the example project, DebugReportExample.zip containing SalesByCountry.rptdesign, from http://www.actuate.com/birt/contributions. This tutorial provides instructions about how to import the project into your workspace and how to debug the report.
Task 1: Prepare the report for debugging
This task assumes you have already uncompressed the example project into your workspace and opened BIRT Report Designer.
1 Import the project to the workspace.
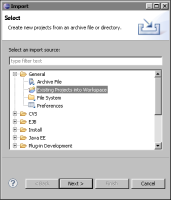
1 Choose File➛Import.
2 In Import, choose General➛Existing Projects into Workspace as shown in Figure 41‑17.
Figure 41‑17 Importing an existing project
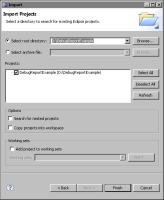
2 On Import Projects, in Select root directory, type the path to the workspace folder in the file system or choose Browse to find the folder.
3 Select the DebugReportExample project, as shown in Figure 41‑18.
Figure 41‑18 Selecting the project to import
Choose Finish. Navigator displays the imported project.
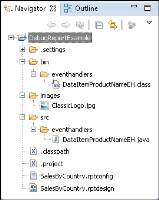
4 Expand the project to review its contents, as shown in Figure 41‑19. The project contains the report design and supporting files, such as the Java event handler class DataItemProductNameEH.java and the logo image ClassicLogo.jpg.
Figure 41‑19 Reviewing the project in Navigator
5 Choose the Problems view to confirm that the project compiled properly. If you see errors similar to those in Figure 41‑20, update your Java build path to correct the paths to your BIRT Engine libraries. If you do not see errors, proceed to step 7.
Figure 41‑20 Reviewing errors in the Problems view
6 Update the Java build path.
1 In Navigator, right-click the DebugReportExample project and choose Properties from the context menu.
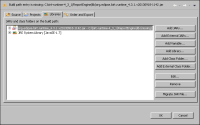
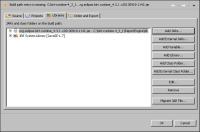
2 In Properties, select Java Build Path. Errors indicate the missing libraries. In JARs and class folders on the build path, select the BIRT run‑time library, as shown in Figure 41‑21, and choose Edit.
Figure 41‑21 Removing JARs from the build path
3 Navigate to the folder containing the libraries. Select org.eclipse.birt.runtime_<version>.jar. Choose Open.
The JAR location is updated in the build path, as shown in Figure 41‑22.
Figure 41‑22 Adding external JARs to the build path
4 In Properties, choose OK. The errors in Problems disappear. If errors remain, right-click the DebugReportExample project. Choose Validate.
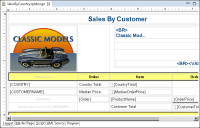
7 In Navigator, double-click SalesByCountry.rptdesign to open the report design. The report layout looks like the one shown in Figure 41‑23.
Figure 41‑23 Viewing the layout of the report design
8 Choose Run➛View Report➛In Web Viewer to see the report. Enter Parameters appears.
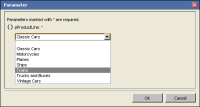
9 In pProductLine, choose Trains from the drop-down list, as shown in Figure 41‑24. Choose OK.
Figure 41‑24 Selecting a parameter
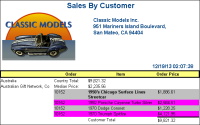
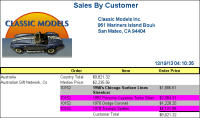
The report preview looks like the one in Figure 41‑25. The orders displaying in dark gray on the image and in fuchsia on your screen have a price greater than the median price of $1814.40. The orders having a price less than the median price are displayed in a light gray color, which displays silver on your screen. Orders for trains appear in a Bold font.
Figure 41‑25 Previewing the SalesByCustomer report
Task 2: Set a JavaScript breakpoint
In this task, you set breakpoints in JavaScript code. During debugging, you stop at a specific execution point and inspect variables.
1 Choose Layout to return to the layout editor.
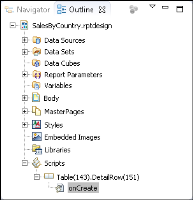
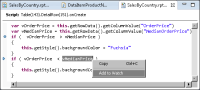
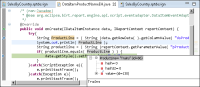
2 In Outline, expand Scripts and Table. Select the onCreate method, as shown in Figure 41‑26. In the editor, choose Script. The code appears in the script editor.
Figure 41‑26 Selecting the onCreate script
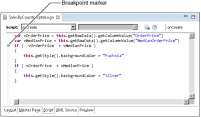
3 In Script, to set a breakpoint, double-click the gray border at the left side of the following line:
if ( vOrderPrice > vMedianPrice );
The breakpoint appears in the gray border as a blue circle, as shown in Figure 41‑27.
Figure 41‑27 Setting a JavaScript breakpoint
Another way to add a breakpoint, as Figure 41‑28 shows, is to right-click the gray border to the left of the line on which to add the breakpoint and from the context menu, choose Toggle Breakpoint.
Figure 41‑28 Using Toggle Breakpoint
Task 3: Set a Java breakpoint
To debug a Java event handler, open the Java source file in the Java editor and set breakpoints. Use the same techniques to create a breakpoint as for a JavaScript event handler.
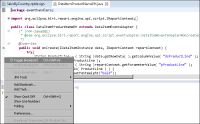
1 In Navigator, right-click DataItemProductNameEH.java. From the context menu, choose Open. The file opens in the Java editor.
2 To set a breakpoint, double-click the gray border to the left of the following line. Alternatively, place the cursor in the line of code and choose Run➛Toggle Breakpoint, as shown in Figure 41‑28.
3 Choose Window➛Open Perspective➛Other➛Debug to open the Debug perspective.
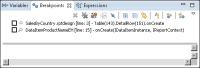
4 Choose the Breakpoints view to review the list of the breakpoints, as shown in Figure 41‑29.
Figure 41‑29 Reviewing breakpoints
Task 4: Create the debug configuration
In this task, you set up the debug configuration. The default configuration uses the current opened report design as the default report file to debug. Change this file name and other debug settings as required. Then, debug the report on your workstation by running the debug configuration.
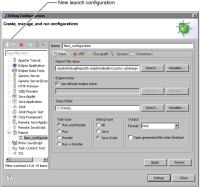
2 From the list of launch types, select Report. From the toolbar, choose New launch configuration. A new configuration appears, as shown in Figure 41‑30.
Figure 41‑30 Setting up a debug configuration
3 In Name, type:
SalesByCustomer
4 In Debug type, select All.
5 In Output, select:
Open generated file when finished
Leave the suggested default values for the rest of the settings.
6 Set the Java Classpath. Add the path to the event handler class to ensure the report engine can find the class.
1 In Debug Configurations, choose Classpath.
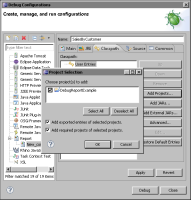
2 In Classpath, select User Entries and then choose Add Projects. Project Selection appears.
3 Select the DebugReportExample project as shown in Figure 41‑31. The list of available projects includes projects in your workspace, which is likely to be different from the list shown in Figure 41‑31.
Figure 41‑31 Adding a project to the Java classpath
Choose OK. DebugReportExample is added to the classpath.
7 In Debug Configurations, choose Apply to complete the creation of the debug configuration.
Task 5: Debug the report
Debugging supports performing the following tasks:
Stepping through the source in the script and Java editors as it executes
Managing breakpoints from the script editor and the Breakpoints view
Examining variable values in the Variables view
Evaluating expressions and viewing the results
Following the output of the program in the Console view
To make programs easier to debug, do not put multiple statements on a single line. Most of the debugger features operate on a line basis. For example, you cannot step over or set line breakpoints on more than one statement in a line.
1 Choose Debug. The debugging environment may take a few moments to start. Debug displays the status of the launch process in the bottom right corner of the screen, as shown in Figure 41‑32.
Figure 41‑32 Process status
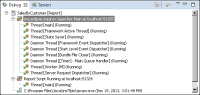
Depending on your setup, the debug process appears in the Debug stack view, as shown in Figure 41‑33.
Figure 41‑33 Inspecting the Debug view
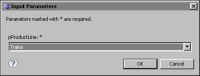
2 In Input Parameters, select Trains, as shown in Figure 41‑34.
Figure 41‑34 Entering the report parameter
Note that in debug mode, Input Parameters displays the parameter names, pProductLine and pStyle, instead of the display text. Displaying the parameter name supports finding the parameter in the Report Design perspective and provides information about values each parameter takes.
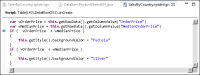
Choose OK. The report runs, and in a few seconds, execution stops at the breakpoint in the JavaScript onCreate method, as shown in Figure 41‑35.
Figure 41‑35 Stopping at the JavaScript breakpoint
3 Inspect the console messages.
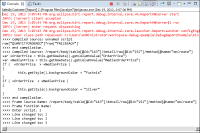
1 In Console, scroll down to look at the debug messages, as shown in Figure 41‑36. The messages present information about the compiled and executed code in the report. These informational messages are written by different modules in the debug plug-in, org.eclipse.birt.report.debug.internal.core. The first few messages appear in red on your screen and come from the Java execution environment.
Figure 41‑36 Inspecting debug messages in Console
2 The next set of messages, preceded with angle brackets, are compilation messages for the JavaScript expressions and the script in the report’s onCreate( ) event.
3 The last few lines in the console, shown in Figure 41‑36, trace the execution of each line of script. Note that the last message points to line 3 in this code snippet. You set the breakpoint at this line, as shown in Figure 41‑35.
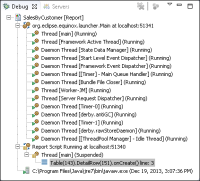
4 Observe the Debug view, as shown in Figure 41‑37. This view shows the current debug target, the thread, and the current stack frame.
Figure 41‑37 Inspecting the Debug view
The status of the current execution is Suspended. The highlighted line in Figure 41‑37 shows the location of the suspended thread.
The last line shows the location of javaw.exe. The javaw.exe process is the Java Virtual Machine that runs programs written in the Java programming language.
5 Press <F6> to step over to the next line. The current row is highlighted in the script editor. A new message indicating the execution moved to line 7 appears in the Console view.
6 Inspect variable values.
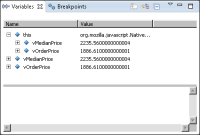
1 In Variables, note the values of vMedianPrice and vOrderPrice, as shown in Figure 41‑38. Expand the this variable in the Variables view. The two variables, vMedianPrice and vOrderPrice, also appear as properties of the this variable.
Because vOrderPrice is less than vMedianPrice, expect the style for this row to change to silver.
Figure 41‑38 Inspecting structures and values in the Variables view
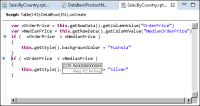
2 To use an alternative way to check variable values, move the mouse pointer over the variable in the script editor, as shown in Figure 41‑39.
Figure 41‑39 Using the mouse pointer to show the value of a variable
3 In the script editor, double-click vMedianPrice to select the text. Then, right-click vMedianPrice and choose Watch from the context menu, as shown in Figure 41‑40.
Figure 41‑40 Adding a variable to watch
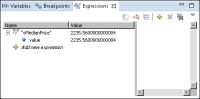
The variable is added to the Expressions view. Expand vMedianPrice, as shown in Figure 41‑41.
If the Expressions view is not visible, choose Show View from the Windows menus and select Expressions to add the view.
Figure 41‑41 Inspecting the Expressions view
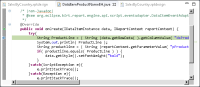
7 Press Resume <F8> to restart the report generation. Execution stops again at the breakpoint in the DataItemProductEH.java, as shown in Figure 41‑42.
The debugger stops at this breakpoint as many times as there are records returned by the report query.
Figure 41‑42 Stopping at a breakpoint in DataItemProductNameEH.java
8 Press <F6> to step over to the next line.
9 Press <F6> again. The current line of code executes and the product line, Trains, appears in Console.
10 In the Java editor, place the cursor at the following line:
data.getStyle().setFontWeight("bold");
11 Press <CTRL-R> to run the code to the current line. Report execution resumes and stops at the current line.
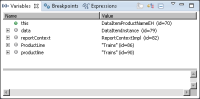
12 In the Variables view, inspect the available variables in the current context, as shown in Figure 41‑43.
The current order is for the product line, Trains, so expect it to appear in the report in bold font.
Figure 41‑43 Inspecting the variables during report execution
13 In the Java editor, move the mouse pointer over the ProductLine text, as shown in Figure 41‑44. The debugger parses the text and shows the value if it is available.
Figure 41‑44 Moving the mouse pointer over Java text
14 In the Breakpoints view, deselect the two breakpoints, as shown in Figure 41‑45. In the next run, the debugger will not suspend execution at these breakpoints.
Figure 41‑45 Disabling breakpoints
15 Press <F8> to resume the execution. As you selected Open the generated file in the debug options, the file opens after the debug process terminates. A new browser window containing the generated report appears, as shown in Figure 41‑46.
Figure 41‑46 Viewing the report in the browser
16 Examine the Debug view for the terminated debug process, as shown in Figure 41‑47.
Figure 41‑47 Inspecting the final status of the debug process