One of the key features of any report is the ability to display summary, or aggregate, information. For example, a sales report can show the overall sales total; sales subtotals by product type, region, or sales representatives; average sales figures; or the highest and lowest sales figures.
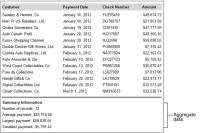
Aggregating data involves performing a calculation on a set of values rather than on a single value. For a simple listing report, aggregate calculations are performed on values in a specific field, over all the data rows in the report. The listing report in Figure 13‑1 displays aggregate data at the end of the report.
Figure 13‑1 A simple listing report that displays detail and aggregate data
In the example, BIRT calculates the average payment in the report by adding the values in the Amount field in every row, then dividing the total by the number of rows. Similarly, BIRT returns the largest and smallest payment amounts by comparing the amount values in every row in the report.
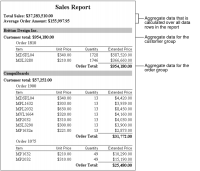
For a report that groups data, as shown in Figure 13‑2, you can display aggregates for each group of data rows, as well as for all the data rows in the report.
Figure 13‑2 A grouped report that displays detail and aggregate data