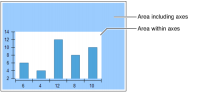
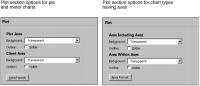
When you adjust the plot area, you can modify the entire plot area, which includes the axes, or only the area that appears within the axes. Figure 21‑58 shows the two sections of the plot in a sample bar chart. The darker area shows the area including axes. The smaller, lighter area shows the area within the axes. To use one color across the entire plot, select that color in both areas.
Figure 21‑58 Plot areas
Setting the color, outline, or shadow for the plot
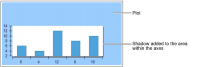
The default background color for the plot is transparent. You can also use a standard color, a custom color, a color gradient, or an image. Also, you can outline the plot and change the line color, style, and width. To highlight the plot area within the axes, you can use a shadow, similar to the one in Figure 21‑59. You add a shadow by setting the Shadow option in Area Format.
Figure 21‑59 Plot using a shadow
Placing and adding space around the plot
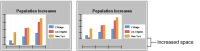
You use anchor settings to modify where the plot appears within the chart and inset settings to determine how much padding appears between the plot and other chart features. You can use plot spacing settings to modify the space between the plot area and the chart axes. Plot spacing includes horizontal and vertical settings. For example, Figure 21‑60 shows the effect of increasing the horizontal spacing in a bar chart. In the second chart, the space between the horizontal axis and the bottom edge of the plot is much larger. To change the spacing around the plot, you set inset and spacing options in Area Format.
Figure 21‑60 Charts using different horizontal plot spacing
Specifying the plot size
You can use the height hint and width hint settings to suggest a minimum height and width for the plot. In most cases, BIRT Report Designer uses the values you supply to size the plot. If you set a plot size that is too large to fit in the total design space, or if other chart elements such as the legend or a title are too large to accommodate the suggested plot size, BIRT Report Designer ignores the settings.
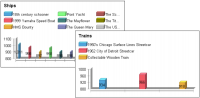
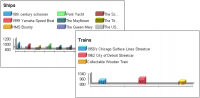
A height or width hint is most useful in a report that uses multiple charts, such as a report with different chart elements or a report that includes a chart element in a group section. Because chart sizing is dynamic, one chart element can produce multiple charts with plots of different sizes, as shown in Figure 21‑61.
Figure 21‑61 Charts created not using a height hint
Height and width hints help you to regulate the plot sizes in a group of charts. For example, the illustrations in Figure 21‑62 show that charts using a value for the Height Hint setting maintain the same height.
Figure 21‑62 Effect of setting a height hint
The following procedures describe how to set the background color for a plot and how to include an outline or shadow and make adjustments in the size and placement of the chart.
To set a background color for the plot, navigate to the Plot section of Format Chart, shown in Figure 21‑63. Choose Background for either Area Including Axes or Area Within Axes, then use the color picker to select a background color. To apply the color to the plot, choose Finish.
Figure 21‑63 Plot section options in Format Chart
How to modify the plot area
1 Navigate to Plot in the Chart Area section of Format Chart.
You see one of the two types of plot sections, as shown in Figure 21‑63, depending on the type of chart.
2 To make an outline of an area visible, select Visible in Outline for one or both areas.
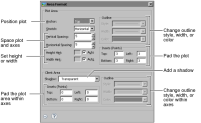
3 To make other modifications to the area, choose Area Format. Figure 21‑64 shows the options you can set using Area Format. Options that appear in Area Format vary. Formatting options depend on the type of chart that you select.
Figure 21‑64 Options in Area Format
4 Modify any of the following options:
The outline style, width, or color
Padding to add space on any or all sides of the plot
Shadow, using the color picker to select a shadow color
Position of the plot
Space between the vertical edge of the plot and the vertical axis
Space between the horizontal edge of the plot and the horizontal axis
Padding around the plot area enclosed by the 2D axes
Constraints on the height or width of the plot block
5 When you are done, close Area Format, then choose Finish on the chart builder to save your changes.