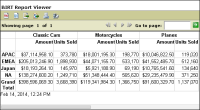
A cross tab can display any number of measures. For example, a cross tab that displays aggregate data by product line and territory can show the sales total in dollars, the number of units sold, the number of customers, and so on. Figure 23‑41 shows a cross tab that displays two measures, sales total amounts and total units sold.
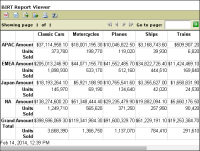
When you insert multiple measures, by default, the cross tab displays the measures horizontally, as shown in Figure 23‑41. You can specify that the cross tab display them vertically instead, as shown in Figure 23‑42.
Figure 23‑41 Cross tab displaying two measures side by side
Figure 23‑42 Cross tab displaying two measures, one above the other
A comparison of the cross tabs in Figure 23‑41 and Figure 23‑42 shows that displaying measures vertically reduces the width of the cross tab and increases its height. So, besides your preference for reading the values horizontally or vertically, use this layout option to adjust the height and width of a cross tab.
How to insert multiple measures in a cross tab
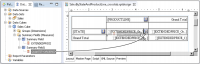
1 Drag a measure from the cube and drop it in the detail area of the cross tab.
2 Similarly, insert the second measure next to the first measure.
To display the second measure to the right of the first measure, drop the measure when the line cursor appears to the right of the data element for the first measure, as shown in Figure 23‑43.
To display the second measure to the left of the first measure, drop the measure when the line cursor appears to the left of the data element for the first measure.
Figure 23‑43 Inserting a measure to the right of another measure
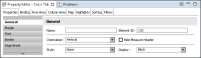
How to display measures vertically
1 Select the cross tab.
2 In Property Editor, select General properties.
3 In Orientation, select Vertical. Figure 23‑44 shows this option selected.
Figure 23‑44 Select the option to display measures vertically