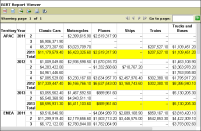
A cross tab displays one column or one row for each unique value in a field used as a dimension, if there is measure data to display. The cross tab in Figure 23‑58 displays sales totals by product line, territory, year, and quarter. Notice that these rows are missing: APAC 2011 Q1, APAC 2013 Q3, and APAC 2013 Q4. The cross tab skips these rows because there is no sales data for those quarters.
Figure 23‑58 Cross tab missing rows for quarters for which no sales data exists
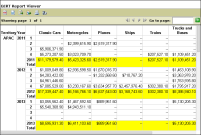
You can add those missing rows, as the cross tab in Figure 23‑59 shows. Similarly, you can also add missing columns. Add missing rows and columns to make it clear that there is no data for certain categories. In this example, displaying all the quarters also makes the data appear complete and consistent. Use this feature judiciously. Adding missing rows and columns can result in a cross tab that shows too many empty cells.
Figure 23‑59 Selecting Show empty rows
How to display empty rows and columns
1 Select the cross tab.
2 In Property Editor, under Properties, choose Empty Rows/Columns.
The Empty Rows/Columns page shows the dimensions for which empty rows and columns can be added.
3 Select either Show empty rows or Show empty columns, or both.
4 In the last field, type the string to display in the empty cells.
5 Preview the report. Figure 23‑60 shows an example of empty rows added for quarters that do not contain sales data.
Figure 23‑60 Cross tab displaying rows for quarters for which no sales data exists