Displaying user-defined values in row and column headings
By default, the row and column headings in a cross tab display dimension values exactly as they appear in the data set fields. These values can sometimes be cryptic or ambiguous. You can replace such values with more descriptive terms.
Sometimes, certain values appear infrequently in a set of rows. Consider the example in which certain products sell very poorly. In a cross tab that displays sales data by product and month, rather than display a row for every product and show many empty cells, you can group all the unpopular products into one user‑defined value named Others.
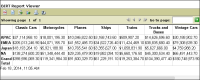
Compare the reports in Figure 23‑61, Figure 23‑62, and Figure 23‑63. The report in Figure 23‑61 shows sales by territory and product line. The territory values appear exactly as they appear in the territory field.
Figure 23‑61 Cross tab displaying sales totals by territory and product line
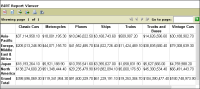
Figure 23‑62 Cross tab displaying full territory names
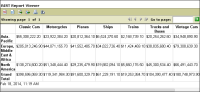
Figure 23‑63 Cross tab displaying sales totals grouped into regions
The report in Figure 23‑62 shows the same data, except that the abbreviated territory names are replaced with full territory names. In this example, even though Japan appears exactly as it does in the database, a static substitution is still provided.
The report in Figure 23‑63 shows sales data where the number of territories has been reduced; Japan has been included with Asia‑Pacific. The modified territory values are created using expressions that group territories into user‑defined regions. Grouping the data provides a different view of the data and can help eliminate empty values from the cross tab. BIRT calculates the new sales totals according to the user‑defined groups.
How to specify user‑defined values for row and column headings
1 In Data Explorer, expand Data Cubes, and double-click the cube.
2 In Data Cube Builder, choose Groups and Summaries.
3 Select the dimension to edit, then choose Edit.
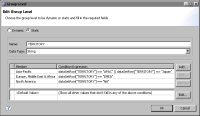
4 In Group Level, select Static. This option indicates that this dimension displays static values that you define.
5 Create a member-expression entry for each value to display.
In Member, type the value to display in the cross tab.
In Condition Expression, type the expression that indicates the value to replace.
Figure 23‑64 shows examples of member-expression entries to display the following values:
Asia-Pacific in place of APAC and Japan. The expression is: