BIRT Report Designer styles are a hybrid of CSS and Microsoft Word styles. You can use the following methods:
Create a named style, and apply it to a report element.
For example, you can create a style called ColumnHeading, then apply the style to all column headings in a report. This approach is like using Microsoft styles in that you create a Body Text style then apply this style to selected paragraphs.
Apply style properties to predefined style names, or selectors.
These predefined style names correspond to the different types of report elements. For example, you can apply style properties to a style called table‑header, and all table headers in a report will be formatted accordingly. This technique is like using CSS in that you associate styles with HTML elements, such as <H1> or <P>.
You will find it useful to create styles using both techniques. The first technique is useful for creating specialized styles for different types of text content, such as important notes, offer notices, or copyrights. The second technique provides a powerful way to define style properties once for a container element and have those properties cascade to the container’s contents. For example, to apply a default format, such as the Arial typeface, to all elements in a report, apply the format to the predefined style name, report. After doing so, all text in the report appears in Arial.
Table 11‑7 lists the predefined style names for which you can set style properties.
Table 11‑7 Predefined style names
Predefined style name
Applies style properties to...
chart
All elements in a chart. Use the predefined chart style to set general formats that you want to apply to all charts, such as boxes around all charts, or a particular font family to use as the default. To format each element in a chart, use the formatting options in the chart builder.
crosstab
All parts of a cross tab, and all elements in a cross tab.
crosstab-cell
Cross tab cells, including elements within them.
crosstab-column-header
The part of the cross tab that displays the column headings, excluding the total headings.
crosstab detail
The part of the cross tab that displays the aggregate values.
crosstab-header
The entire row and column header area of the cross tab.
crosstab-row-header
The part of the cross tab that displays the row headings, excluding the total headings.
data
Data elements.
grid
Grids, including elements within them. For example, if you specify a background color, the entire grid displays the specified color.
image
Image elements.
label
Label elements.
list
Lists, including elements in them.
list-detail
Detail area of lists, including elements in that area.
list-footer
Footer area of lists, including elements in that area.
list-group-footer-n
A specific group footer (1–9) in lists that contain groups of data.
list-group-header-n
A specific group header (1–9) in lists that contain groups of data.
list-header
Header area of lists, including elements in that area.
page
The report’s master page.
report
All elements in the report. The report is the topmost container. Any formatting you set for this style applies to everything in a report.
table
Tables, including elements in them.
table-detail
Detail rows of tables, including elements in the rows.
table-detail-cell
Cells in the detail rows of tables.
table-footer
Footer rows of tables, including elements in the rows.
table-footer-cell
Cells in the footer rows of tables.
table-group-footer-n
A specific group footer (1–9) in tables that contain groups of data.
table-group-footer-cell
Cells in the group footer rows of tables.
table-group-header-n
A specific group header row (1–9) in tables that contain groups of data.
table-group-header-cell
Cells in the group header row of tables.
table-header
Header rows of tables, including elements in the rows.
table-header cell
Cells in the header rows of tables.
text
Text elements.
text-data
Dynamic text elements.
TOC-level-n
A specific level (0–9) in a hierarchical table of contents. For reports that contain groups of data, BIRT automatically creates a table of contents, which users can use to jump to different parts of the report.
If creating styles using the cascading model, it is best to design a set of styles from the top-level container down. At the top level, define style properties that you want to apply to all elements, then add style properties at each successive level. For example:
Use the report style to specify a default font family and font size for the entire report.
Use the table style to specify a default font size and text alignment for all data in tables.
Use the table-header style to specify bold font and a background color for table headers.
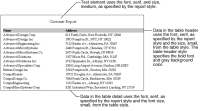
Any element you insert in a table header inherits the style properties from the report, table, and table-header styles. Any element you insert in a table detail inherits style properties from the report and table styles. Figure 11‑6 shows the results of applying the cascading concept to styles.
Figure 11‑6 Report that shows the use of cascading styles
Not all style properties cascade. For example, the background color, margins, borders, and padding properties do not cascade from a container to the elements within it. In these cases, cascading the style does not make good design sense. For example, it does not make sense to cascade border values because designs typically use different border values for different elements. A design might use a border around a table without using borders around rows, columns, cells, or elements in cells.
For details about each property, including the cascading rule, see the ROM Styles specification document, which is available at the following URL:
http://www.eclipse.org/birt/phoenix/ref/
How to create a style
1 In the layout editor, select the report element to which you want to apply a style. To create a style but not apply it to any elements, click in an empty area on the report page.
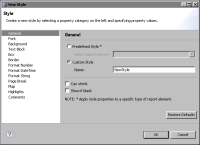
2 Choose Element➛Style➛New Style. New Style appears, as shown in Figure 11‑7. The left side displays the property categories. The right side displays the properties for the category that you select.
Figure 11‑7 New Style
3 Specify one of the following settings:
To apply style properties to a specific type of report element, select Predefined Style, and select a style from the drop-down list.
To create a user-named style, select Custom Style, and specify a unique descriptive name. Ensure that the name is not the same as any of the predefined style names. If you specify a name that is the same as a predefined style, your custom style takes precedence, and you can no longer use the predefined style to apply cascading styles.
4 Set the desired style properties by selecting a property category on the left and specifying property values.
5 When you finish setting style properties, choose OK to save the style. If you selected an element before you created the style, BIRT Report Designer applies the style to that element.
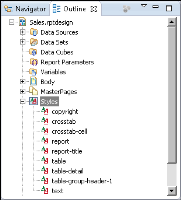
The custom styles and predefined styles that you define appear in Outline, as shown in Figure 11‑8. Any time you want to change a style, access it from this view.