If a table displays many rows, it can be hard to read the data. A common solution is to use alternating colors for the rows, as shown in Figure 11‑24.
Figure 11‑24 Conditional formatting that displays rows in alternating colors
To create this effect, use the conditional formatting feature, as described in the preceding section. In the example shown, if the row number is even, set a darker color as the row’s background color. If the row number is odd, leave the row’s background color unchanged from its default.
Note that BIRT counts the first row as 0, so what appears as the first row is actually row 0, what appears as the second row is actually row 1, and so on. In other words, the rows that appear to be odd-numbered rows in the generated report are technically even‑numbered rows, and vice versa. In the report that appears in Figure 11‑24, the gray color applies to even‑numbered rows.
How to alternate row colors
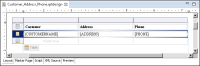
1 Select the detail row in the table, as shown in Figure 11‑25.
Figure 11‑25 Detail row selected
2 In General properties in Property Editor, choose a color for Background Color, or use the default value, Auto. This color is the default color for the detail rows.
3 Choose the Highlights tab in Property Editor to create a formatting rule to apply a different color to alternate rows.
4 In the Highlights page, choose Add to create a formatting rule.
5 In New Highlight, specify an expression in the first field:
1 Next to the first field, choose the expression builder button.
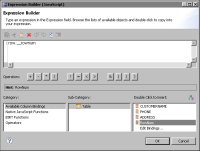
2 In the expression builder, select Available Column Bindings, then select Table, then double-click RowNum. The following expression appears in the text area, as shown in Figure 11‑26:
row.__rownum
Figure 11‑26 The expression builder showing the row.__rownum expression
3 Change the expression to:
row.__rownum % 2
row.__rownum represents the current row number. The modulus (%) operator returns the remainder of a division. 2 specifies the number by which to divide. Using this expression, even‑numbered rows return 0, and odd‑numbered rows return a non‑zero value.
4 Choose OK to save the expression. The expression appears in the first field in New Highlight.
6 In the second field, choose either Equal to or Not Equal to:
To apply the formatting rule to even-numbered rows, choose Equal to.
To apply the formatting rule to odd-numbered rows, choose Not Equal to.
7 In the third field, type the following number:
0
0 specifies the value to compare to the result of the expression, row.__rownum % 2. This value completes the condition part of the formatting rule as follows:
If row.__rownum % 2 Equal to (or Not Equal to) 0
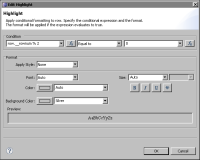
8 Specify the color to assign to the even- or odd-numbered rows by choosing a color for Background Color. Figure 11‑27 shows an example of a completed format rule. The rule sets the background color of even‑numbered rows to silver.
Figure 11‑27 New Highlight dialog showing a completed format rule
Choose OK.
9 Preview the report. The detail rows should appear in alternating colors.
Use row.__rownum and the % operator with different values to alternate colors for a different number of rows. For example, the following highlight expressions change the row color for every three and every five rows, respectively: