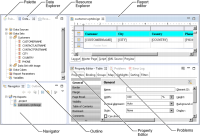
The BIRT Report Designer views provide tools that you use to build and customize a BIRT report design, preview the report, and debug the report. Figure 1‑3 shows the views that open by default in the Report Design perspective.
Figure 1‑3 BIRT Report Designer views
Each view is a window you can close, resize, minimize, or maximize. You can also move each view to a different location, either inside or outside the application window. Change or rearrange the set of views to fit the way you work or to fit in the available screen space.
Report editor
This window is where you design and preview your report. You can open multiple reports in the report editor. The report editor has five pages, which you access by choosing the tabs at the bottom of the report editor. The pages are:
Layout editor, where you create and edit your report design. Figure 1‑3 shows the layout editor.
Master Page, which shows items, such as the date and page number, that appear on every page.
Script editor, where you add JavaScript code to your report. You can create many reports without programming. Typically, you write code only if you want to change the way in which BIRT generates a report.
XML Source, which shows the XML content that BIRT Report Designer generates when you create a report.
Previewer, which runs your report and displays the output.
Palette
The palette shows all the elements that you can use in a report to organize and display data. To lay out a report, you can drag elements from the palette and drop them in the report page in the layout editor.
Data Explorer
Data Explorer shows the data sources, data sets, and report parameters that your report uses. Use Data Explorer to create, edit, or delete these items. You can also use Data Explorer to add data set fields to your report.
Resource Explorer
Resource Explorer shows the shared resources available to your reports. Resources can include images, style sheets, and libraries. A library is a collection of report elements that can be used by more than one report. Use Resource Explorer to view the resources you can use in a report or to insert report elements from a library in a report.
Property Editor
Property Editor displays the properties of the report element currently selected in the layout editor. It organizes properties by functional categories. Use it to apply style or format settings to the contents of your report.
Navigator
Navigator shows all your projects and the reports within each project. Use it to manage your report files. Each project is a directory in the file system. Using Navigator, you can open files, delete files, rename files, or move files from one project to another. If you add files to a project directory through the file system, for example, through Windows Explorer, you need to refresh the project in Navigator to update the list of reports.
Outline
Outline shows the structure of your report as a tree view. It shows the hierarchy of elements in a format that is similar to the outline view of a Microsoft Word or PowerPoint document. You expand or collapse parts of the report by choosing the plus (+) or minus (–) signs. Outline also shows all the resources that are used by or defined in a report, including data sources, data sets, libraries, and styles. You can select items in Outline to edit, delete, rename, or copy them.
Problems
Problems displays messages about errors in the report designs in the current project. It describes the error, says which report file contains the error, provides the location of the file, and indicates the line numbers in which the error occurs.