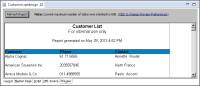
This section provides step-by-step instructions for building a report that lists customer names, phone numbers, and contact names. The report uses data from the sample database that is supplied with BIRT Report Designer, Classic Models, Inc. Figure 1‑4 shows a portion of the finished report.
Figure 1‑4 Report listing customer names, phone numbers, and contacts
In this tutorial, you perform the following tasks:
Eclipse organizes files by projects. You can create one project to organize all your reports or create multiple projects to organize your reports by categories. For each project that you create, Eclipse creates a directory in your file system.
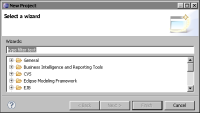
1 Choose File➛New➛Project. New Project, which appears in Figure 1‑5, displays the types of projects that you can create.
Figure 1‑5 New Project
2 If necessary, expand Business Intelligence and Reporting Tools, select Report Project, then choose Next.
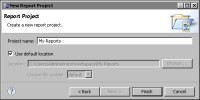
3 In New Report Project, in Project name, type the following text, as shown in Figure 1‑6:
My Reports
Figure 1‑6 New Report Project
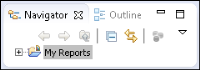
4 To add the project, choose Finish. You can now see the project in the Navigator view, as shown in Figure 1‑7.
Figure 1‑7 A project in the Navigator view
Task 2: Create a new report
You can create a report in the following ways:
Start with a blank report design.
Use a predefined report template.
For each template, BIRT Report Designer provides a cheat sheet, which contains step-by-step instructions, to help you create the report.
For this tutorial, you start with a blank report design.
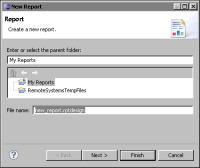
1 Choose File➛New➛Report. New Report appears. Figure 1‑8 shows the window that appears in BIRT Report Designer.
Figure 1‑8 New Report in BIRT Report Designer
2 In BIRT Report Designer, in the tree view of the available folders, select the project that you created.
3 Type the following text as the file name:
Customers.rptdesign
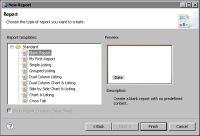
4 Choose Next. New Report provides options for starting with a blank report and several report templates, as shown in Figure 1‑9.
Figure 1‑9 Report templates in New Report
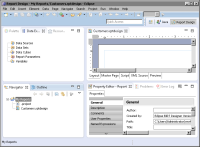
5 Select Blank Report, then choose Finish. Your new report appears in the main window. This window displays the layout editor, as shown in Figure 1‑10. The layout editor shows an empty report page.
Figure 1‑10 Blank report design
The remainder of this tutorial provides the detailed steps for creating the customer report.
Task 3: Build a data source
Before you begin designing your report in the layout editor, you build a BIRT data source to connect your report to a database or other type of data source. When you build a data source, you specify the driver class, data source name, and other connection information that is specific to the type of data source. For this tutorial, you use the sample database, Classic Models, Inc., that is already configured for use with BIRT Report Designer. You do not need to specify the connection information for this sample database.
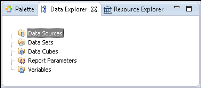
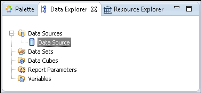
1 Choose Data Explorer. If you use the default report design perspective, Data Explorer is to the left of the layout editor, next to Palette, as shown in Figure 1‑11. If Data Explorer is not open, choose Window➛Show View➛Data Explorer.
Figure 1‑11 Data Explorer
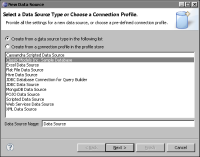
2 Right-click Data Sources, then choose New Data Source from the context menu. New Data Source displays the types of data sources you can create, as shown in Figure 1‑12.
Figure 1‑12 New Data Source
3 Select Classic Models Inc. Sample Database from the list of data source types. Use the default data source name, then choose Next. Connection information about the new data source appears.
4 Choose Finish. BIRT Report Designer creates a new data source that connects to the sample database. It appears within Data Sources in Data Explorer, shown in Figure 1‑13.
Figure 1‑13 Data Sources in Data Explorer
Task 4: Build a data set
Now, you are ready to build your data set. A data set identifies the data to retrieve from the data source. If your report connects to a JDBC data source, such as the sample database, you use a SQL SELECT statement to specify the data to retrieve.
1 In Data Explorer, right-click Data Sets, and choose New Data Set from the context menu.
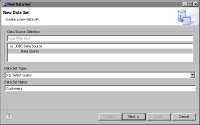
2 In New Data Set, in Data Set Name, type the following text, as shown in Figure 1‑14:
Customers
Figure 1‑14 New Data Set
3 Use the default values for the other fields.
Data Source Selection shows the type and name of the data source that you created earlier.
Data Set Type indicates that the data set uses a SQL SELECT query.
4 Choose Next.
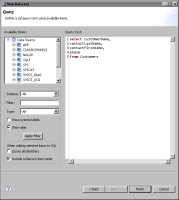
The Query page displays information to help you create a SQL query. Available Items lists all the schemas in the data source, including CLASSICMODELS, which you use for this tutorial and other reports you want to create with the sample database. You can click the plus (+) sign next to CLASSICMODELS to display the tables. The text area on the right side of this dialog shows the following required keywords of a SQL SELECT statement:
select
from
5 In the text area, type the following SQL SELECT statement to specify the data to retrieve:
select customerName,
contactLastName,
contactFirstName,
phone
from Customers
Figure 1‑15 SQL SELECT statement in Edit Data Set
Although the data set editor shows table and column names in uppercase letters, you can type these names in the case you prefer because SQL is not case‑sensitive. If you do not want to type the query, you can drag columns and tables from Available Items to the text area.
The SELECT statement that you created, which is shown in Figure 1‑15, gets values from the CUSTOMERNAME, CONTACTLASTNAME, CONTACTFIRSTNAME, and PHONE columns in the CUSTOMERS table.
6 Choose Finish to save the data set. If you typed the query correctly, Edit Data Set appears. If you made a mistake, an error message appears before Edit Data Set opens. Edit Data Set displays the columns you specified in the query, and provides options for editing the data set.
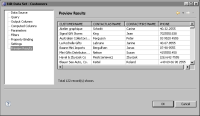
7 Choose Preview Results to make sure the query is valid and that it returns the correct data. Figure 1‑16 shows some of the data rows that the query returns.
Figure 1‑16 Data rows returned by a SQL SELECT statement
8 Choose OK.
Task 5: Lay out the report
In this procedure, you insert elements in the report page to display the data from the data set that you created previously. You start by inserting a table element, then you insert data elements in the table. It is important to understand the functionality that the table provides. The table:
Iterates through all the data rows that a data set returns
Enables you to lay out data easily in a row and column format
1 Choose Palette. The palette displays all the elements that you can place in a report.
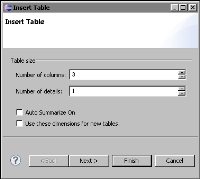
2 Drag a table element from the palette, and drop it in the report in the layout editor. Insert Table prompts you to specify the number of columns and detail rows to create for the table. The dialog also prompts you to select a data set to bind with the table.
3 In Insert Table, specify the following values, as shown in Figure 1‑17:
In Number of columns, type 3.
In Number of details, type 1.
Figure 1‑17 Table properties in Insert Table
4 Choose Finish. A table appears in the layout editor.
5 Choose Data Explorer.
6 In Data Explorer, expand Data Sets, then expand Customers. The columns that you specified in the query appear below Customers.
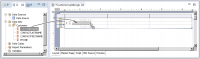
7 Drag CUSTOMERNAME from Data Explorer, and drop it in the first cell in the table’s detail row, as shown in Figure 1‑18. The detail row displays the main data in the report. In the generated report, the detail row repeats to display all the data rows from the data set.
Figure 1‑18 Dragging a column from Data Explorer and dropping it in a table cell
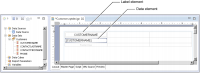
In the layout editor, the table cell in which you dropped the CUSTOMERNAME field contains a data element that displays [CUSTOMERNAME]. Above this data element is a label element that the layout editor automatically added to the header row. This label displays the field name as static text. It serves as the column heading. Figure 1‑19 shows the data and label elements.
Figure 1‑19 Data and label elements in a table
8 Drag PHONE from Data Explorer, and drop it in the second cell in the detail row.
9 Drag CONTACTFIRSTNAME, and drop it in the third cell in the detail row.
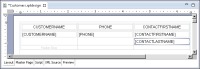
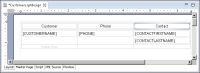
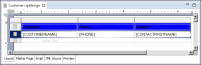
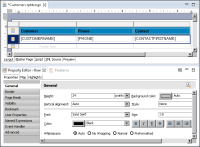
10 Drag CONTACTLASTNAME, and drop it in the third cell in the detail row, below CONTACTFIRSTNAME. The report page should look like the one shown in Figure 1‑20.
Figure 1‑20 Customer and contact information added to a table
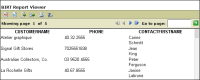
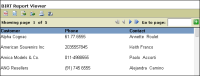
11 Choose Run➛View Report➛In Web Viewer. BIRT Report Designer generates and displays the report in HTML format, as shown in Figure 1‑21.
As Figure 1‑21 shows, the data is correct, but it appears in random order. It makes more sense to sort the data alphabetically by customer name. The report’s appearance also needs improvement.
Figure 1‑21 Preview of report data
Task 6: Sort the data
When you first create and preview a report, the report displays the data rows in the order in which the query returns them. The order can vary, depending on many factors, such as how data was supplied in the data source. In most cases, you will want to change the order in which data appears in the report.
1 Choose Layout to return to the layout editor.
2 Open Property Editor, if necessary. If you use the default report design perspective, Property Editor appears below the layout editor. If it is not open, choose Window➛Show View➛Property Editor.
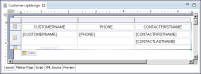
3 In the layout editor, select the table by selecting the Table tab in the lower left corner, as shown in Figure 1‑22. This tab appears when you hover the mouse pointer over the lower left corner of the table.
Figure 1‑22 Selecting the table
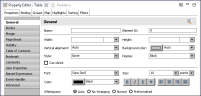
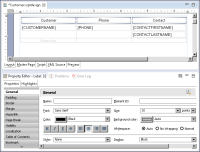
Property Editor displays the properties for the table, as shown in Figure 1‑23.
Figure 1‑23 Property Editor displaying the general properties of the table
4 Choose the Sorting tab, then choose Add to specify a sort key.
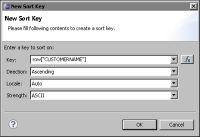
5 In New Sort Key, specify the following values:
In Key, select CUSTOMERNAME from the drop-down list.
Choose OK. The Sort page displays the defined sort key.
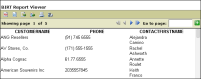
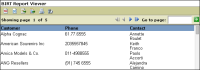
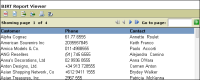
6 View the report. The sorted data appears in ascending order by customer name, as shown in Figure 1‑25.
Figure 1‑25 Data sorted by customer name
Notice that names with uppercase letters appear at the top of the list. BIRT sorts string data by UCS-2 code point values. In ASCII-based character sets, uppercase letters have lower code point values than lowercase letters. Therefore, uppercase letters appear before lowercase letters.
7 Sort the customer names case-insensitively so that ANG Resellers appears after American Souvenirs Inc., rather than before.
1 Choose Layout to return to the layout editor.
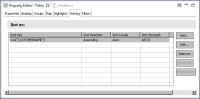
2 In the Sort page, shown in Figure 1‑26, select the sort key, then choose Edit.
Figure 1‑26 Sort key displayed on the Sort page
3 In Edit Sort Key, change the Sort Key expression to the following expression, then choose OK:
row["CUSTOMERNAME"].toUpperCase()
This expression uses the JavaScript toUpperCase( ) function to convert all the customer name values to uppercase before sorting. JavaScript function names are case-sensitive, so you must type toUpperCase( ) exactly as shown. References to column names are also case-sensitive. In this expression, row["CUSTOMERNAME"] is the correct name to use. If you type row["customername"], for example, BIRT Report Designer displays an error when you run the report. You can verify the capitalization of a column name by looking at the name that is displayed in Data Explorer.
8 View the report.
Task 7: Format the report
Now that you verified that the report displays the correct data in the correct order, you can turn your attention to improving the report’s appearance. You perform the following tasks in this section:
Edit the text of the column headings.
Format the column headings.
Display the contact first and last names on the same line.
Increase the space between rows.
Edit the column headings
1 Choose Layout to return to the layout editor.
2 Double-click the first column heading, CUSTOMERNAME. The column heading is in the first row—the header row—of the table.
3 To replace all the highlighted text, start typing, then press Enter when you finish. To edit the text, click once to deselect the text, then position the cursor where you want to add or delete characters.
Replace CUSTOMERNAME with the following text:
Customer
4 Repeat steps 2 and 3 to change the second and third column headings to the following text:
Phone
Contact
The report design should look like the one shown in Figure 1‑27.
Figure 1‑27 Revised column headings in a report design
Format the column headings
To format a report element, set its properties in one of the following two ways:
Set an element’s properties through Property Editor. Use this method to format only the selected element.
Define a style that contains the desired properties, and apply the style to an element. Use this method to define format properties once and apply them to more than one element.
You might notice that in the report design, the column headings appear in plain text and are center-aligned. The generated HTML report, however, displays the column headings in bold and centered. This discrepancy occurs because BIRT uses the browser’s default format for items placed in a table header.
In this procedure, you use Property Editor to align the column headings to the left, and you define a style to add color to the header row.
1 To format the column headings using Property Editor:
1 Select all the column headings. To select multiple elements, press and hold the Shift key as you click each element. Property Editor displays the properties for the selected elements, as shown in Figure 1‑28.
Figure 1‑28 Properties for selected elements in Property Editor
2 Choose the Left button to align the column headings to the left.
3 Choose the B button to format the column headings as bold text.
4 Deselect the column headings by clicking the white space outside the table.
2 To add a background color to the header row, using a style:
1 From the main menu bar, choose Element➛Style➛New Style.
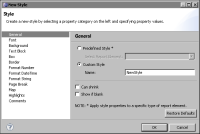
New Style appears, as shown in Figure 1‑29. The left side displays the property categories. The right side displays the properties for the category that you select.
Figure 1‑29 New Style
2 For Custom Style, type the following name for the style:
table_header_row
3 Choose Background from the list of property categories. New Style displays the background properties that you can set.
4 Specify a color for the Background Color property, using one of the following methods:
Select the button next to the property, then select a color from the color palette that appears.
Select a color from the drop-down list.
Choose OK.
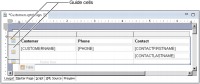
5 In the layout editor, select the table. Selecting the table causes guide cells to appear at the top and left side of the table, as shown in Figure 1‑30.
Figure 1‑30 Guide cells at the top and left of a table
6 Select the guide cell next to the header row.
7 In Property Editor, choose Properties, then choose General to display the general properties for the row.
8 Apply the style that you just created by selecting table_header_row from the drop-down list next to Style. BIRT Report Designer applies the style to the header row and it appears in color.
3 View the report. The report should look like the one shown in Figure 1‑31.
When you place multiple elements in a single cell, BIRT Report Designer creates block-level elements. If you are familiar with HTML, you know that each block element starts on a new line. To display multiple elements on the same line, you need to set them as inline elements. Alternatively, you can concatenate the first and last name values to display in a single data element, as described in this procedure.
1 Choose Layout to return to the layout editor.
2 Delete the data element that displays [CONTACTLASTNAME].
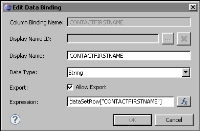
3 Double-click the data element that displays [CONTACTFIRSTNAME].
Edit Data Binding, shown in Figure 1‑32, shows information about the data associated with the current data element. In Expression, dataSetRow["CONTACTFIRSTNAME"] indicates that the data element displays data from the CONTACTFIRSTNAME field in the data set.
Figure 1‑32 Edit Data Binding
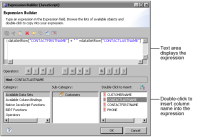
4 Click the expression builder button next to the Expression field.
The expression builder displays the expression in the text area at the top of the window.
5 To concatenate the first and last names, edit the expression as follows:
Figure 1‑33 shows this expression in the expression builder. The empty quotation marks (" ") add a space between the first name and last name. You can type the expression in the text area or double-click an item in the lower right of the window to insert it in the expression.
Figure 1‑33 The expression builder displaying the expression to concatenate data
6 Choose OK to close the expression builder.
The edited expression appears in Edit Data Binding.
7 Choose OK to save the changes to the data element.
8 View the report. The report should look like the one shown in Figure 1‑34.
The default layout adds a minimum space between table rows. Typically, you will want to adjust the spacing between rows.
1 Choose Layout to return to the layout editor.
2 Select the table’s detail row, the middle row, as shown in Figure 1‑35.
Figure 1‑35 Selected table row in the layout editor
Property Editor displays the properties for the row. The title that appears in Property Editor shows the type of element that you select, so you should see Property Editor—Row.
3 In the General properties, set Height to 24 points. The height of the row increases, as shown in Figure 1‑36. Save the report.
Figure 1‑36 Row height set to 24 points
4 View the report. The report should look like the one shown in Figure 1‑37. There is more space between the rows of data.
All your report needs now is a title. To display a title, you can use either a label element, a text element, or a data element. The following list describes each type of element:
The label element is suitable for short, static text, such as column headings.
The data element is suitable for displaying dynamic values from a data set field or a computed field.
The text element is suitable for multiline text that contains different formatting or dynamic values.
In this procedure, you use a text element and HTML tags to format the text. Note that you are not required to use HTML to create formatted text. If, however, you are well‑versed in HTML or web design, you might prefer using HTML to create a block of formatted text.
1 Choose Layout to return to the layout editor.
2 Choose Palette.
3 Drag the text element from the palette, and drop it above the table.
4 In Edit Text Item, select HTML from the drop-down list that displays Auto.
When you select HTML, you can embed HTML tags or CSS properties in the text. You can type the tags or you can insert the commonly used HTML tags that the text editor provides.
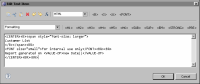
5 Specify the following text in the text area, shown in Figure 1‑38:
<CENTER><B><span style="font-size: larger">
Customer List
</B></span><BR>
<FONT size="small">For internal use only</FONT><BR><BR>
Report generated on <VALUE-OF>new Date( )</VALUE-OF>
</CENTER><BR><BR>
Figure 1‑38 Text with HTML tags
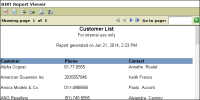
6 Choose OK, then view the report. The report should look like the one shown in Figure 1‑39.
Figure 1‑39 Report preview showing formatted report title
As you can see, using the text element with embedded HTML enables you to:
Use different formatting for each line in a multiline text block.
Insert dynamic values, such as the current date.
Alternatively, you can use:
Two label elements to display the first and second lines of static text
A data element to display the third line that contains the dynamic value
Next steps
You just built your first report and worked with some of the basic tools and features of BIRT Report Designer. There are many more tasks that you can accomplish to build more sophisticated reports. Some of these tasks, described in other chapters of this book, include
Connecting to your own data source
Creating charts
Creating cross tabs
Creating report parameters for user input
Building reports that contain subreports
Formatting report elements based on conditions
Hiding report elements or sections based on conditions
Adding hyperlinks to link your report to web locations or to link one report section to another