As with a BIRT chart, you format an HTML5 chart using one or both of the following methods:
Use the chart builder’s Format Chart page to set style properties for the different parts of the chart.
Apply a chart theme, which defines styles for the different parts of a chart. Themes provide a flexible way to define and maintain styles in one place and reuse them for any chart that you create. BIRT Designer Professional provides several predefined themes for HTML5 charts. For a custom look, create your own chart themes.
If using both methods to format a chart, the properties in the chart theme function as the basis for the chart’s appearance. Properties that you set in the Format Chart page override properties set by the theme.
The user interface indicates clearly whether a property is set by a theme or set in the chart builder. Properties presented as a list box or as radio buttons display the value Auto for default values that are set by a theme or by the software. These properties display a specific value if set in the chart builder.
Properties set through check boxes have three states—on, off, and default. A check mark indicates the on state, an empty check box indicates the off state, and a check box with a gray check mark or a blue square indicates the default state. The symbol for the default state changes depending on the Windows theme that your machine uses.
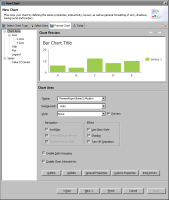
A default state is set by a theme or the software, and the default state is either on or off. Even though it can appear counter-intuitive, a gray check mark does not necessarily mean that a property is on by default. For example, the Use Glass Style property, available in the Format Chart page, as shown in Figure 22‑2, is set to the default state, and the software’s default value is off. To apply the glass style to the chart, you would click the check box until it displays a check mark.
Figure 22‑2 Selecting themes and effects for a bar chart
Similarly, the property below it, Turn Off Animation, is set to the default state, which is off. In other words, animation is turned on by default. To disable animation, you would click the check box until it displays a check mark. For information about standard chart formatting options, see Laying out and formatting a chart.
Applying a chart theme
On the Format Chart page, Theme displays the theme currently applied to the chart, or None, if a theme is not applied. To change the theme or apply one, select a theme from the drop-down list. The list displays all the predefined themes, as well as, the themes that you created. When you select a theme, the chart previewer shows the changes instantly.
Creating a chart theme
HTML5 charts support two types of chart themes:
A general chart theme that you create with the graphical chart theme builder, and which you can apply to both BIRT and HTML5 charts.
A JavaScript theme that you can apply to HTML5 charts only. These themes use JavaScript and the Highcharts API. Use this programming option to define chart attributes that are not available through the graphical chart theme builder, or if you are more comfortable writing scripts and prefer to view all attributes in text format on a single page.
A typical approach to designing chart themes, whether general or JavaScript, is to create one theme for all chart types. Use this approach to design a consistent presentation style for all chart types, one that uses corporate styles, for example. Such a theme can define general attributes, such as color schemes for the chart background and plot areas, font styles for chart titles, value labels, or axis labels, border styles, and legend styles.
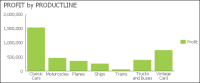
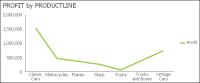
The charts in Figure 22‑3 and Figure 22‑4 are examples of how a bar chart and a line chart appear in a consistent style when the same theme is applied. The charts use the same color schemes, fonts, grid, border and legend styles. In these examples, the charts use a predefined chart theme, ThemesReportItems3.Modern. You can use the same design principles when creating custom themes.
Figure 22‑3 Bar chart using a predefined theme, ThemesReportItems3.Modern
Figure 22‑4 Line chart using the same theme, ThemesReportItems3.Modern
You can create a chart theme in a report design or in a library. Create a chart theme in a library—the typical approach—to share the theme with other report developers or to use the theme in other reports. A chart theme defined in a report design is available only to charts in that report.
If an existing chart contains the formatting attributes you want to set in a theme, export the attributes to a theme. To do so, open the chart in the chart builder, then click the button at the top right side of the chart builder, and specify a name for the new theme. BIRT creates a theme that contains all the formatting attributes from the chart. The theme is created in the report that contains the source chart and is accessible through the Outline view for the report design. To place this theme in a library, copy it from the Outline view and paste it into a library.
The predefined chart themes included with BIRT Designer Professional are defined in a library, ThemesReportItems3.rptlibrary. You can download this library from the Resources folder in Actuate BIRT iServer to use as an example when creating your own library of themes.
Creating a general chart theme
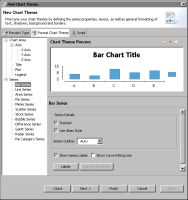
The chart theme builder, which you use to create a general chart theme, organizes and presents properties in a similar way as the Format Chart page of the chart builder. Figure 22‑5 shows the Format Chart Theme page where you set formatting attributes for the different parts of a chart. The preview section shows your formatting changes for the selected chart type, which you choose in the Preview Type page.
Figure 22‑5 Format Chart Theme page of the chart theme builder
Use the Script page to write event-handling code for a theme. This code applies only to HTML5 charts. It is ignored when the theme is applied to a BIRT chart. Information about writing event handlers is provided later in this chapter.
How to create a general chart theme
1 In Outline, right-click Themes and choose New Report Item Theme.
2 In New Report Item Theme, specify the following information:
In Name, type a name for the theme.
In Type, select Chart.
Choose OK.
3 In Chart Theme Wizard, select the first option, General, to define a theme. Choose Next.
4 In the chart theme builder, shown in Figure 22‑5, define the style properties for the chart theme.
5 Choose Finish.
Creating a JavaScript chart theme
As mentioned earlier, BIRT Designer Professional uses Highcharts, a third-party charting library, to render HTML5 charts. To create a JavaScript chart theme, you set the Highcharts chart options to values that provide the visual attributes you desire. Every option has a default value. You define attributes only to change default settings, or to add items that do not appear by default.
Listing 22‑1 shows the JavaScript code for the tooltips of predefined chart theme, Modern. The charts in Figure 22‑3 and Figure 22‑4 use this theme. As the code shows, options are set using a JavaScript object notation structure. Keys and values are connected by colons, separated by commas, and grouped by curly brackets.
For a complete reference of the options and their descriptions, see the Highcharts documentation at the following location:
http://api.highcharts.com/highcharts
The Highcharts reference contains two sections, the Configuration options and Methods and properties. Look at the Configuration options for information about the options you can set in a chart theme.
Listing 22‑1 JavaScript code for the chart theme Modern
1 In Outline, right-click Themes and choose New Report Item Theme.
2 In New Report Item Theme, specify the following information:
In Name, type a name for the theme.
In Type, select Chart.
Choose OK.
3 In Chart Theme Wizard, select the second option, HTML5, to define a theme. Choose Next.
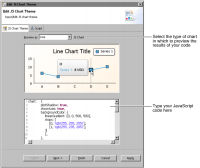
4 In the JavaScript chart theme builder, shown in Figure 22‑6, write code that defines the desired style properties for the chart theme. The Preview section displays the results of your code for a selected chart type.
Figure 22‑6 Example of JavaScript code and preview of a bar chart
5 To write event-handling code, described in the next section, choose the Script tab. Choose Finish to close the theme editor.