Property | Usage |
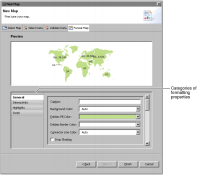
Background Color | Sets the background color of the map. |
Canvas Border Color | Specifies the color of the border around the entire map. |
Caption | Adds a caption to the map. |
Connector Line Color | Specifies the color of the line between the entity name and the entity location. |
Drop Shadow | Enables or disables the appearance of a shadow below the map. |
Entities Border Color | Specifies the color of the border around the location entities. |
Entities Fill Color | Specifies the color within the border of an entity location. |
Font Color | Specifies the color of the text. |
Font Faces | Specifies the name of the font. |
Font Size | Specifies the font size in points. |
Format Number | Enables or disables number formatting. |
Format Number Scale | Abbreviates a number to an appropriate number factor. For example, 10,000 becomes 10K. |
Fraction Digits | Specifies the number of digits displayed after the decimal point. |
Hover Effect Color | Specifies the color of the location entity under the mouse pointer. |
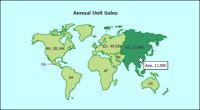
Include Name in Labels | Enables or disables the display of location entity names. |
Include Value in Labels | Enables or disables the display of the location entity’s value. |
Legend Caption | Specifies the name displayed above the map legend. |
Legend Position | Specifies the position of legend in relation to the map. |
Number Prefix | Specifies a text value to display before a number. |
Number Suffix | Specifies a text value to display after a number. |
Short Name in Tool Tip | Enables or disables the display of the short name of a location entity in a tooltip. For example, NA is the short name of North America. |
Show Border | Enables or disables the border around the map. |
Show Entity Tool Tip | Enables or disables the display of a tooltips when a mouse pointer is placed over the entity. |
Show Labels | Enables or disables the display of labels. |
Show Legend | Enables or disables the display of a legend when highlight ranges exist. |
Use Hover Effect | Enables or disables the highlighting of a location entity when the mouse pointer moves over the entity. |
Property | Usage |
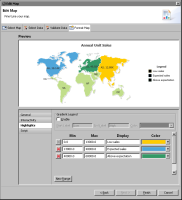
Color | Specifies the color of the region. |
Display | Specifies the name of the region to display in the legend. |
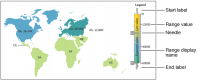
Enable Gradient Legend | Enable the gradient legend. |
End Label | Specifies the name to display at the end of the gradient legend. |
Gradient Legend Color | Specifies a starting color for the gradient legend. |
Max | Specifies the value where the range ends. |
Min | Specifies the value where the range starts. |
Start Label | Specifies the name to display at the start of the gradient legend. |