Pagination is the division of a document into pages of a specified size. It applies to several output formats supported by BIRT, including DOC, ODT, PDF, and PPT. In PPT and ODP, each report page is a presentation slide. By default, reports in these formats display as much data as can fit on each page, up to 40 detail rows. This specification can result in key sections appearing in the middle or at the bottom of a page. For most paginated reports, a common approach is to start certain sections at the top of a new page or avoid breaking a section across two pages.
By contrast, an XLS or ODS report appears on a single spreadsheet; page breaks that you specify in the report design have no effect. Similarly, an HTML report always appears on a single scrollable page when you preview a report in the layout editor or as HTML. The page breaks that you specify take effect when an HTML report is viewed in the report viewer.
Inserting page breaks
Reports that consist of a series of documents or distinct sections typically look more organized if each document or section appears on a separate page. For example, if a report consists of a cover letter, disclaimer information, and a summary report that is followed by a detailed report, you can insert page breaks to display each type of information on a separate page. Similarly, if a report groups sales data by state, then by customer, you can start the data for each state on a new page.
You can specify page breaks for the following elements:
Top-level elements. These are elements that are not placed within another element.
Second-level elements. These are elements that are placed in a top-level list, table, or grid. For example, if table A contains table B, and table B contains table C, you can specify a page break for table A and table B, but not for table C.
Groups. You can specify page breaks for data groups defined in top-level and second-level tables or lists.
Grid rows and detail rows in tables.
Specify page breaks using the Page Break Before and Page Break After properties. Table 26‑1 describes the values you can select for these properties.
Table 26‑1 Values for Page Break Before and After properties
Page Break Before, Page Break After value
Description
Always
Always insert a page break before or after the selected element.
Auto
Insert a page break before or after the element as necessary. Auto is the default value.
Avoid
Avoid inserting a page break before or after the selected element.
Always Excluding First
Applies only to groups and Page Break Before. Always insert a page break before each instance of the selected group, but not before the first instance.
Always Excluding Last
Applies only to groups and Page Break After. Always insert a page break after each instance of the selected group, but not after the last instance.
The rest of this section provides examples of inserting page breaks for various elements. For simplicity, the examples of the generated reports shown in this section are in PDF format. The other output formats that support pagination show similar results.
Inserting page breaks in a report with multiple sections and groups
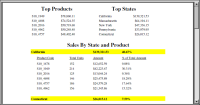
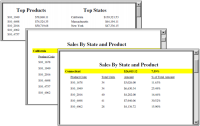
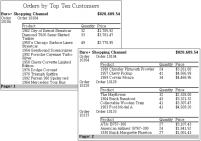
Figure 26‑1 shows a PDF report with default page breaks. In this report, the page break properties are set to Auto. Figure 26‑2 shows the same report with page breaks after the Top Products and Top States reports and after each state group in the Sales By State and Product report. Notice in Figure 26‑2 that the title, Sales By State and Product, repeats at the top of every page of that report. The Repeat Header option is set by default. To display the report header only once, at the beginning of the report, deselect the Repeat Header option.
Figure 26‑1 PDF report using default pagination
Figure 26‑2 PDF report using custom pagination
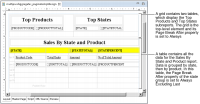
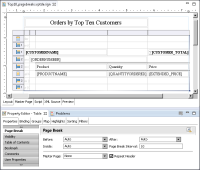
Figure 26‑3 shows the report design and indicates where and how page breaks are set. In this report design, page breaks are set as follows:
The Page Break After property of the grid at the top of the report is set to Always, which inserts a page break after the grid. Alternatively, selecting the top-level table element that appears after the grid and setting its Page Break Before property to Always achieves the same result.
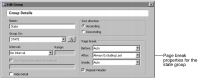
The Page Break After property of the state group is set to Always Excluding Last. This setting inserts a page break after each state group, except for the last group. If the Page Break After property is set to Always, the report displays a blank page after the last group. Alternatively, set the state group’s Page Break Before property to Always Excluding First. This setting inserts a page break before each state group, except for the first group, and prevents a blank page from appearing before the first group.
Figure 26‑3 Page break property settings in a report design
Figure 26‑4 shows a partial view of the group editor where you set the state group’s Page Break After property.
Figure 26‑4 Page break properties for a group
Inserting page breaks in a master-detail report
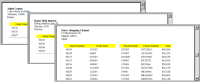
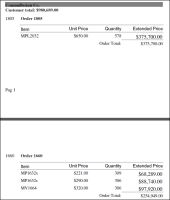
In the next example, a report displays data with a master-detail relationship. An outer, top-level table contains two inner tables. The top-level table displays customer information. For each customer, the inner tables display order information and payment information, respectively. Figure 26‑5 shows the PDF report that is paginated so that each customer’s information starts on a new page.
Figure 26‑5 PDF output starting each customer’s data on a new page
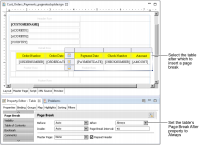
Figure 26‑6 shows the report design and indicates where and how the page break is set. The Page Break After property of the second-level table is set to Always.
Figure 26‑6 Report design that starts each customer’s data on a new page
Avoiding page breaks in a section
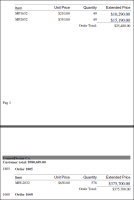
In addition to specifying where page breaks occur, you can also specify that contents of a particular report section stay on the same page, when possible. Figure 26‑7 shows a portion of a PDF report that groups items sold by order number and by customer. The figure shows the detail rows for an order split onto two pages.
Figure 26‑7 Detail rows of an order appear on two pages
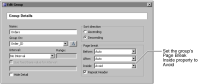
You can keep the order details together by setting the Page Break Inside property of the orders group to Avoid, as shown in Figure 26‑8.
Figure 26‑8 Page Break Inside set to Avoid for orders group
Figure 26‑9 shows the results of setting the Page Break Inside property of the orders group to Avoid. All the detail rows for the order appear on the same page. To keep the rows together, BIRT starts the order on a new page.
Figure 26‑9 Detail rows that were previously split appear on the same page
To keep all the orders for each customer together, set the customer group’s Page Break Inside property to Avoid. Figure 26‑10 shows the results of setting the Page Break Inside property of the customers group to Avoid. The data for each customer stays together on the same page. If the data for a customer does not fit in the remaining space on a page, the customer record starts on a new page.
Setting an element’s Page Break Inside property to Avoid does not guarantee that the contents of the section always appears on the same page. If the contents of a section exceed one page, the content has to appear on more than one page.
Use Page Break Inside sparingly. Computing where data should appear and where to insert page breaks is resource‑intensive. In addition, if some sections contain a lot of data, the pages of the generated report are likely to display a lot of white space at the bottom, as the PDF report in Figure 26‑10 shows.
Figure 26‑10 Customer data that was previously split appears on the same page
Specifying the number of rows per page
Specifying page breaks before or after selected sections or groups in a report is the typical way to control pagination. Another way is to insert a page break after a specified number of data rows. For example, in a simple listing report that does not contain groups or multiple sections, you could display twenty rows on each page.
While the typical case for specifying the number of rows per page is for a simple listing report, you can also apply this pagination method to a report that groups data.
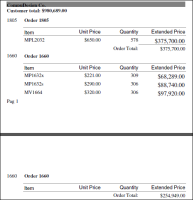
Figure 26‑11 shows two pages of a report that displays 10 data rows per page in the report viewer. The report groups products sold by customer and by order number. Notice that only detail rows are counted. Group header and footer rows are not counted. As Figure 26‑11 also shows, detail rows in a group can be split onto multiple pages, not a result you typically want.
Figure 26‑11 Report pages displaying 10 data rows per page
To specify the number of data rows per page, select the table element that contains the data and set the table’s Page Break Interval property. The Page Break Interval property applies page breaks to all output formats, except HTML, ODS, and XLS. Figure 26‑12 shows the report design that generates the report shown in Figure 26‑11. The selected table has its Page Break Interval property set to 10.
Figure 26‑12 Table displaying its Page Break Interval property set to 10
The default value for Page Break Interval is 40. For output formats that have a fixed page size, such as PDF and DOC, a page typically fits fewer than 40 data rows, so the default Page Break Interval value does not have any effect. Each page displays as many rows as will fit. Page Break Interval has a noticeable effect only if it is set to a number smaller than the number of rows that can fit on a fixed-size page. In that case, each page displays the specified number of rows followed by blank space.
When displaying the report in the report viewer, however, the Page Break Interval value is significant whether it is set to a low number or a high one. Unlike a report in PDF or DOC format, each page in the report viewer can display hundreds of data rows.
To display an entire report on one page in the report viewer, set Page Break Interval to 0. Note, however, that if the report is very long, a single page takes longer to generate than multiple shorter pages.