Tutorial 3: Adding an interactive chart filter to a BIRT report
In this exercise, you add an interactive chart control to a BIRT report design that implements a filter on the other charts in the report design. You perform the following tasks:
Task 1: Add bookmarks
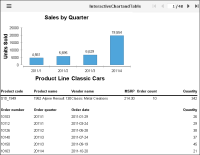
In this task, you preview a report called InteractiveChartandTable.rptdesign and add a bookmark to the chart and table.
1 In Navigator, open InteractiveChartandTable.rptdesign.
2 Choose Run
➛View Report
➛In Web Viewer to view the report, as shown in
Figure 1‑25.
Figure 1‑25 Previewing the report
3 Choose Layout to return to the layout editor.
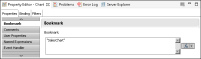
4 Select the chart entitled Sales by Quarter. In the property editor, open Properties
➛Bookmark. Set the bookmark value to "SalesChart", as shown in
Figure 1‑26.
Figure 1‑26 Setting the chart bookmark property
5 Repeating the process of step 5, for the table entitled Product Line, set the bookmark value to "ProductTable".
Task 2: Add a filter script to chart interactivity
In this task, you add a filter script to the Sales by Quarter chart to affect the other charts.
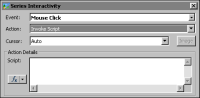
1 Double-click on the Sales by Quarter chart. In Edit Chart, select Format Chart➛Series➛Value (Y) Series. Then choose Interactivity.
2 On Series Interactivity, select Mouse Click for event, and Invoke Script for action, as shown in
Figure 1‑27.
Figure 1‑27 Interactivity settings for invoking a script on mouse click
3 In the Script text box, add the following code:
var atable = actuate.getViewer(evt.srcElement || evt.target).getCurrentPageContent( ).getTableByBookmark("ProductTable" );
atable.setFilters(new actuate.data.Filter("QUANTITYORDERED", actuate.data.Filter.GREATER_THAN, valueData/200));
atable.submit();
In Edit Chart, choose Finish.
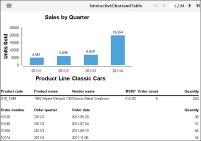
4 View the report by choosing Run➛View Report➛In Web Viewer.
5 Select a bar in the table to activate the filter, as shown in
Figure 1‑28.
Figure 1‑28 Filtered product table after selecting a chart value