Understanding column bindings
For each piece of data to display or use in a report, there must be a column binding. For this discussion, note that data refers to dynamic data, and not the static text that you type for a label. Dynamic data is data from a data set, or data that is calculated from a function or a formula. The data is dynamic because the values are not fixed at design time.
The default column binding, which BIRT Designer creates for a data set field, uses the data set field name as the name of the column binding. In
Figure 3‑1, the expression defined for the first column binding is dataSetRow["CITY"]. This expression indicates that the column binding accesses data from the data set field, CITY. In the layout editor, the column-binding name appears within square brackets ([ ]), as shown in
Figure 3‑1.
Figure 3‑1 Table’s binding page showing four column bindings
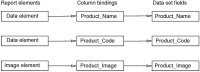
Column bindings form an intermediate layer between data set data and report elements—such as chart, data, dynamic text, and image elements—that display data.
Figure 3‑2 illustrates this concept. Report elements can access data only through column bindings.
Figure 3‑2 Report elements access data set data through column bindings
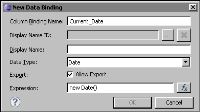
The preceding examples show column bindings that access data in a data set. Column bindings can also access data derived from functions or user-defined formulas. For example, you can use a data element to display the current date derived from the JavaScript Date object. You would create a column binding that uses the following expression:
new Date()
Figure 3‑3 shows this column binding definition.
Figure 3‑3 User-defined column binding