Enhancing the usability of a data model
Business users use data models as data sources when they design reports with Report Studio. Users also use data models when they view crosstab reports with Interactive Crosstabs or create dashboard gadgets. You can make a data model more usable for these users by doing the following:

Creating categories of fields.
Renaming columns.
Creating computed columns.
Specifying drill paths.
Creating a category
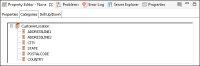
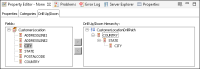
By default, a data model contains one category for each data set in the data model. A data model, however, can contain a large number of data sets, and each data set can contain a large number of columns. You can make a data model more usable by creating understandable categories and grouping related columns together. For example, you can create a category called CustomerLocation that contains the columns ADDRESSLINE1, ADDRESSLINE2, CITY, STATE, POSTALCODE, and COUNTRY, as shown in
Figure 10‑21. The CustomerLocation category is visible to users in the Available Data pane in Report Studio, the Categories pane in Interactive Crosstabs, or the Select Data dialog in dashboards.
Figure 10‑21 CustomerLocation category
How to create a category
1 Open the data object that contains the data model.
2 In Data Explorer, select the data model.
3 In Property Editor, choose Categories.
4 In Property Editor—Categories, right-click in the white space and choose New Category.
5 In New Category, type the category name. Choose OK.
6 In Property Editor—Categories, right-click the new category and choose New Column.
7 In Add Category Column, choose a data set from the drop-down list.
8 Select the appropriate columns from the list. Choose OK.
9 If necessary, repeat steps
6 through
8.
Renaming a column
Column names are often not very descriptive. You can enhance the usability of a data model by giving columns descriptive names. The names are visible to users in the Available Data pane in Report Studio, the Categories pane in Interactive Crosstabs, or the Select Data dialog in dashboards.
How to rename a column
1 Open the data object that contains the data model.
2 In Data Explorer, select the data model.
3 In Property Editor, choose Categories.
4 In Property Editor—Categories, right-click the column and choose Rename Column.
5 In Rename, type a new name for the column. Choose OK.
Creating a computed column
While it is possible to create computed columns in Report Studio, Interactive Crosstabs, or dashboards, it is more convenient for the user if you create them in the data model. For example, you can create a computed column that calculates the extended price for an order line item or a computed column that displays the full name of a customer contact:
QuantityOrdered * PriceEach
ContactFirstName || ' ' || ContactLastName
You can create statements that provide if-then-else logic, for example:
CASE WHEN QuantityInStock > 0 THEN 'In Stock' ELSE 'Out of Stock' END
How to create a computed column
1 Open the data object that contains the data model.
2 In Data Explorer, select the data model.
3 In Property Editor, choose Categories.
4 In Property Editor—Categories, right-click a column that will appear in the computed column expression and choose New Computed Column.
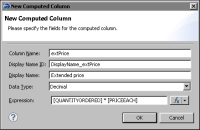
5 In New Computed Column, provide values for the following fields, as shown in
Figure 10‑22. Choose OK.
Column Name. An alias for the computed column. The alias is visible in Property Editor—Categories and Data Explorer.
Display Name ID. The localization key for the computed column in localization properties files.
Display Name. The field name that is visible to users in the Available Data pane in Report Studio, the Categories pane in Interactive Crosstabs, or the Select Data dialog in dashboards.
Data Type. The computed column’s data type.
Expression. An EasyScript or JavaScript expression. Type the expression or use the Expression Builder.
Figure 10‑22 Creating a computed column
6 If necessary, add the computed column to the appropriate category.
1 Right-click the category and choose New Column.
2 In Add Category Column, choose the data set in which you created the computed column from the drop-down list.
3 Select the computed column from the list. Choose OK.
Specifying a drill path
You can specify drill paths for crosstab reports in Interactive Crosstabs or the crosstab gadget builder. A drill path specifies which fields are displayed when a user drills down on successive levels in the dimension hierarchy.
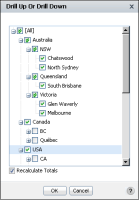
Figure 10‑23 shows the Drill Up Or Drill Down dialog in Interactive Crosstabs with a drill path Country
➛State
➛City. If the user drills down on Australia and then on NSW, detail data for the cities Chatswood and North Sydney appears.
Figure 10‑23 Drill Up Or Drill Down dialog in Interactive Crosstabs
How to specify a drill path
1 Open the data object that contains the data model.
2 In Data Explorer, select the data model.
3 In Property Editor, choose Drill Up/Down.
4 In Fields, select the first field in the drill path and choose >.
5 In New Drill Path Name, type the name of the drill path. Choose OK.
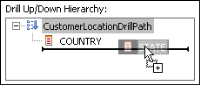
6 In Drill Up/Down Hierarchy, expand the drill path so that the first field is visible.
7 Drag the second field from Fields and drop it in Drill Up/Down Hierarchy. Make sure that the placement bar appears under the first field, as shown in
Figure 10‑24.
Figure 10‑24 Adding a field to the drill path
8 In Drill Up/Down Hierarchy, expand the drill path so that the second field is visible.
9 Add any remaining fields and expand the tree so that all nodes are visible.
Figure 10‑25 Specifying a drill path