Configuring data set columns for summary tables
Summary tables are commonly used in dashboards and Report Studio reports to display key summary information.
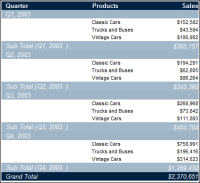
Figure 10‑9 shows an example of a summary table created in Report Studio. Order data is grouped by date, in quarterly intervals, and by product line. The price of each order is summed to display subtotals for each quarter and product line, as well as a grand total.
Figure 10‑9 Summary table
To create a summary table quickly, users select a table’s auto-summarize feature, then select the data set columns whose data to group and aggregate. When the auto-summarize feature is enabled, the software performs the grouping and aggregating. To support this feature, you must configure each data set column to provide the software with the appropriate information to perform these tasks. For example, it makes sense to group sales data by order date or product line, but not by revenue. Conversely, it makes sense to aggregate revenue values, but not order date or product line values.
To provide the appropriate information to generate a summary table, set the Analysis Type property of each data set column to one of the following values:

Dimension
Use this analysis type to support the grouping of data in the column. For example, to display revenue by product line, set the product line column as a dimension.
Attribute
An attribute describes the items associated with a dimension. For a product dimension, for example, attributes might include color, size, and price. When you set a column as an attribute, you must also specify the dimension column of which it is an attribute. The summary table cannot group data in an attribute column.
Measure
Use this analysis type to support the aggregation of values in the column. For example, to calculate revenue totals, set the revenue column as a measure.
If you do not set a column’s analysis type, BIRT Designer Professional assigns a value using the following criteria:
If the column contains numeric values, the analysis type is measure.
If the column contains string, date, or Boolean values, the analysis type is dimension.
If the column is a primary key, a foreign key, or an indexed column in a database, the analysis type is dimension even if the column contains numeric values.
Sometimes, the default analysis type values do not provide sensible data for a summary table. To create a well-designed data object, it is necessary to review the analysis type for every column in the data set. The following are examples of problems with the default values:
Not all numeric columns are suitable as measures. Sometimes, it makes sense to group on numeric values, such as order numbers or customer numbers. In these cases, you would change the column’s analysis type to dimension. Sometimes, it does not make sense to aggregate numeric data, such as MSRP (Manufacturer’s Suggested Retail Price), which might be more appropriate as an attribute of a product dimension.
Not all string columns are suitable as dimensions. For example, if each value in a column, such as product code, is unique, it does not make sense to group on this column. Such a column is better defined as an attribute of a product dimension.
How to set the analysis type of a data set column
This procedure assumes that you have already created a data object and added a data set to it.
1 Open the data object.
2 In Data Explorer, double-click the data set to edit it.
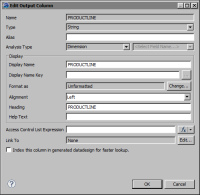
3 In Edit Data Set, choose Output Columns, then double-click the column whose analysis type to set. Edit Output Column displays the properties of the selected column, as shown in
Figure 10‑10.
Figure 10‑10 Properties of a data set column
4 In Analysis Type, select Dimension, Attribute, or Measure. If you select Attribute, in the list box that displays <Select Field Name...>, select a column of which this column is an attribute. The column you select must be a dimension column.