Working with axis labels
By default, a chart displays labels to the left of a vertical axis and below a horizontal axis, as shown in
Figure 13‑85.
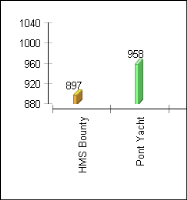
Figure 13‑85 Default axis label positions
You can hide or reposition the labels on an axis. For example, you can show the labels on the y-axis to the right of the axis rather than the left, or rotate the labels on the x-axis so that they are easier to read. You can also modify the label font, add a background color, shadow, or outline, or change the padding around the labels.
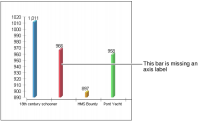
Sometimes, a chart displays so many values on an axis that the label text overlaps and becomes illegible. In this case, the chart builder drops some of the axis labels.
Figure 13‑86 shows a chart in which labels have disappeared. In the chart, only three of four
x-axis labels appear. The chart dropped the second label because it overlapped the neighboring labels.
Figure 13‑86 Chart displaying a missing x-axis label
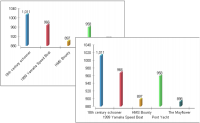
To fix this problem, you can rotate the labels or stagger them, so they do not overlap.
Figure 13‑87 shows the two solutions on an
x-axis. In the chart on the left, rotation of
x-axis labels makes all the labels fit into the space. On the right, staggering labels displays all axis categories.
Figure 13‑87 Rotated and staggered x-axis labels
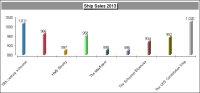
You can also skip labels. For example, in
Figure 13‑88, the chart skips every other label. To skip labels, set the interval at which labels should appear. For example, to show every other label, use an interval of 2. To show every fifth label, use an interval of 5.
Figure 13‑88 Chart showing skipped x-axis labels
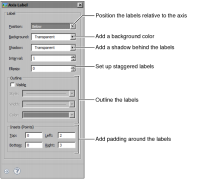
To format axis labels, navigate to the Format Chart section for the axis, then choose Label. Use the Axis Label options, as shown in
Figure 13‑89.
Figure 13‑89 Axis Label formatting options