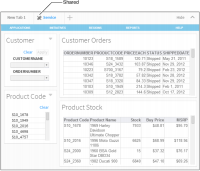
Understanding dashboard functionality
Users interact with data and files using dashboard gadgets. Each gadget is a self‑contained data viewer that can display interactive BIRT files, tables, charts and external data such as HTML pages and web services. Other dashboard gadgets enable users to select data such as a list of customers or a calendar. Dashboard developers can link these gadgets to enhance your ability to select and find the data you need.
Actuate dashboards support the following user activities:

Building web-based reports and performance indicators using charts, tables, cross tabs, and data visualizations

Reviewing multiple BIRT files at the same time or viewing part of a BIRT file instead of the entire file

Displaying and linking multiple data sources

Interacting with data by launching browser-based tools such as Interactive Crosstabs

Keeping information up to date using refresh timers

Exploring and exporting data using filtering, drill‑down analysis, and drill‑through hyperlinks

Mixing external web services with existing business data
Dashboard users can launch browser-based tools such as Interactive Crosstabs to analyze cross tab gadgets. For more information about maximizing gadgets, see
Maximizing gadgets, later in this section.
The Dashboards for iHub option is required to open dashboard files. Some optional features require appropriate BIRT iHub options. For example, to use browser-based tools such as Interactive Viewer for iHub or Report Studio for iHub, the appropriate iHub licensed options are required.
File permissions define which users can edit dashboards files or have read-only access. Shared dashboard files enable groups of users to monitor the same charts and analyze the same data by subscribing to the same dashboard file. User dashboard files are private and enable individuals to build and manage their own dashboard files for personal use.
Your user account defines what you can accomplish with a dashboard file. The Visualization Platform administrator manages the following user types:

All users can refresh dashboards, interact with data selector gadgets, and maximize gadgets for access to browser-based tools such as Interactive Viewer and Interactive Crosstabs. The dashboard file or gadget is reset each time it is viewed.

Business users are the same as basic users but also use report and extra gadget types to create and share dashboards. This user can subscribe to shared dashboard files, copy shared dashboards, and use shared gadgets in their own dashboards. Business users can also share their dashboards.

Dashboard developers are the same as business users but can also create gadget scripts, use data visualization gadgets, and use data selection gadgets.
How to create a new dashboard
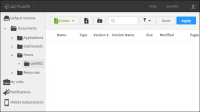
1 If Visualization Platform is not already open, open your web browser and type the URL address to launch Visualization Platform and log in. If you have an assigned home folder, the home folder appears, similar to the one shown in
Figure 4‑2.
Figure 4‑2 My documents
2 Select Create
➛New Dashboard to create a new dashboard, as shown in
Figure 4‑3.
Figure 4‑3 Creating a new dashboard
The new dashboard appears in the dashboard editor.
How to open a dashboard for editing
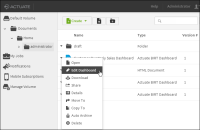
Select the menu icon next to the dashboard you need to edit, then choose Edit Dashboard, as shown in
Figure 4‑4.
Figure 4‑4 Editing a dashboard file
Working with the dashboard editor
Use the dashboard editor to organize and manage dashboard files, for example, add content, change the name of a dashboard tab, or refresh the content displayed in the dashboard. Dashboard options are in the dashboard editor’s menu, as shown in
Figure 4‑5.
Figure 4‑5 Accessing dashboard options
Shared dashboards have fewer options than a user dashboard.
Table 4‑1 lists dashboard options for shared and user dashboards.
Table 4‑1 Dashboard editor options
Option | Description |
File—New Dashboard | Creates a new dashboard file |
File—Open | Opens a dashboard file in the dashboard editor |
File—Print | Prints the contents of the selected dashboard tab page |
File—Save | Saves the current dashboard file |
File—Save As | Saves the dashboard as a file using a new name and location |
Edit—Delete Tab | Removes the selected dashboard tab page |
Edit—Duplicate Tab | Duplicates the dashboard tab as a new dashboard tab |
Edit—New Tab | Adds a new tab to the dashboard |
Edit—Options | Sets tab page options such as name, refresh rate, background color or image, display a header and footer |
Edit—Refresh | Queries and updates data object design, BIRT design, and external files in use |
Edit—Rename Tab | Changes the name of the selected tab page |
Edit—Share Tab | Shares one or more tab pages as a dashboard file |
View—Run | Displays the current dashboard in read-only mode |
View—Hide Grid | Removes the freeform layout grid if it is displayed |
View—Show Grid | Displays a grid when the dashboard layout is set to freeform |
Layout | Selects one‑, two‑, or three‑column layout or freeform layout |
Insert—Chart | Adds a chart or measurement gadget to the dashboard |
Insert—Current Selections | Displays and optionally resets any data selection gadgets on the dashboard |
Insert—Data Selector | Adds a data selector gadget to the dashboard |
Insert—Extra | Adds an HTML, image, import, text, or video gadget |
Insert—Report | Adds a parameter, report, report library, or Reportlet gadget to the dashboard |
Insert—Table | Adds a table or cross tab to the dashboard |
Insert—Dashboard From Gallery | Adds a shared dashboard file as a new tab page to the dashboard |
Insert—Gadget From Gallery | Adds a shared gadget file to the dashboard |
Data—Manage Data | Selects one or more BIRT data objects or BIRT data object stores to be data sources of the dashboard |
Help—Help | Displays the online help |
For information about building and sharing dashboard and gadget files, see Designing Information Applications.
Subscribing to a dashboard file
Shared dashboard files contain one or more dashboard tabs. You subscribe to a shared dashboard by adding it to your dashboard. You can also interact with gadgets on a shared dashboard, for example, using data selectors to filter a report gadget, interact with the data using Interactive Viewer or Interactive Crosstabs. Modifications to gadgets on shared dashboards reset the next time the dashboard refreshes or updates.
Shared dashboards appear with the share icon on the dashboard title to indicate that editing is disabled. Users with write privileges to the dashboard file update shared dashboard files by overwriting the saved version of the dashboard. When a shared dashboard is changed by the dashboard owner, users that subscribe to the dashboard receive the changes the next time the dashboard opens or refreshes.
How to subscribe to a shared dashboard
1 Open a dashboard file to edit or create a new dashboard.
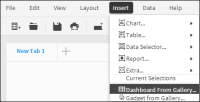
2 In the dashboard editor, choose Insert
➛Dashboard from Gallery, as shown in
Figure 4‑6.
Figure 4‑6 Adding a new dashboard
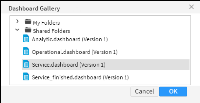
3 In the dashboard gallery, select a dashboard file, as shown in
Figure 4‑7.
Figure 4‑7 Subscribing to a shared dashboard
Choose OK to subscribe to the Service dashboard. If you do not see a folder in the shared folders, you can select My Folders to select from a dashboard in your home folder.
The selected dashboard appears with the shared icon on the dashboard title, as shown in
Figure 4‑8.
Figure 4‑8 Viewing the shared Service dashboard
