BIRT technology provides multiple easy‑to‑use components for visualizing data such as charts, cross tabs, lists, tables, gadgets, and dashboards. Typically, using these components meets the visual application requirements. But with the blossoming world of data visualization, the need for more advanced and more interactive visualizations constantly grows. The Custom Visualization report item enables integrating third‑party interactive data visualizations with BIRT reports.
In a BIRT application, a Custom Visualization report item is a report element that supports inserting custom HTML, HTML5 code, client-side JavaScript, JavaScript libraries, and CSS code in a report, and easily connecting the BIRT data to that visualization. This code is automatically inserted in the body of the generated HTML of the BIRT report.
You use Custom Visualization to provide users with custom interactive reporting functionality. For example, you create a visualization using third‑party JavaScript libraries such as D3, Google Maps, or FusionCharts. Using this report item you integrate your application with other BIRT content and enterprise applications.
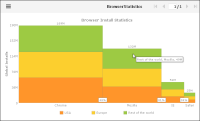
Figure 19‑1 shows an example of a Marimekko chart from FusionCharts visualization.
Figure 19‑1 Marimekko chart from FusionCharts
A Custom Visualization item has the same characteristics as any element that displays information in a BIRT report. You can bind a custom visualization to a data set, and define filtering, sorting, and aggregation associated with the data set binding. Using defined markups, you can map the data in the Custom Visualization code. You can export custom visualizations to the following supported formats:
PDF
XLS
DOC
PPT
BIRT supports out-of-the-box third‑party visualizations by providing templates you can use and customize. The templates provide example code to illustrate simple integrations. For complex implementations you must be familiar with the third-party APIs. If the visualization library you wish to use is not supported, you can still integrate visualizations from this library with BIRT reports by creating your own custom template. An example of such implementation is provided in Integrating unsupported visualizations.
Some third party visualizations require licenses in order to be integrated. You are responsible to obtain the licenses and provide the license keys in the appropriate places in the visualization templates.