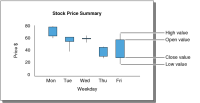
A stock chart shows four sets of numeric data values as points on a time continuum, such as days of the week. Figure 20‑9 shows a sample stock chart.
Figure 20‑9 Stock chart
Stock values appear as a candlestick, a box with lines extending up and down from the ends. Open and close values mark the upper and lower edges of the box. High and low values mark the upper and lower points of the line. The default appearance of the bar depends on the chart values. If the open value is higher than the close value, the box is shaded. If the close value is higher than the open value, the box is white. You can change the color of the shaded boxes.
Although a stock chart typically displays stock price data, you can also use a stock chart to show scientific data, such as temperature changes over time.