A combination chart is a chart that incorporates two or more different chart types. You can combine the following chart types: area, bar, cone, pyramid, stock, tube, or line. Combination charts must use at least two value series, one for each of the chart types displayed.
To create the combination chart, first create a chart of one type, such as a bar chart. Next, define the value series expressions on the Select Data page. To provide more than one value series expression, use the value series drop‑down list. Select New Series, then use the expression field to supply the series expression, as shown in Figure 21‑31.
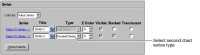
Figure 21‑31 Adding a value series expression
After adding one or more series, use the drop-down list to navigate among the value series definitions.
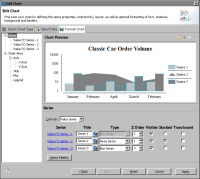
Finally, navigate to the Format Chart page, and in the Series section, select a chart of another type, such as pyramid, as shown in Figure 21‑32.
Figure 21‑32 Creating a combination chart
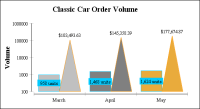
Using multiple value series expressions, you can present more data on the chart. For example, Figure 21‑33 shows a chart with one value series in which bars show order quantities and another in which pyramids show revenue.
Figure 21‑33 Combination bar and pyramid chart
The chart groups the dates by month and shows the unit order volume and revenue for classic cars over a three-month period.
To define the order in which the series appear on a combination chart, set the z‑order rendering priority for the series. On the bar chart shown in Figure 21‑34, the specified z‑order causes the two bar series to appear in front of the area chart.