You can write scripts in JavaScript that specify the task to perform when a particular event occurs. This type of script is called an event handler. Like BIRT charts, HTML5 charts support two types of event handlers:
Event handlers that respond to user interactions, such as a mouse click on a legend or a mouse over a series, when viewing the report. For example, you can create an event handler to link to another report when a user clicks a bar in a bar chart or reorders values displayed in a tooltip from highest to lowest.
Event handlers that respond to chart events, which occur when BIRT renders an HTML5 chart. Use this type of event handler to conditionally change or add chart elements as the chart is being generated. For example, you can write an event handler to calculate an average value and display this value as a marker line.
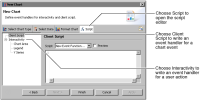
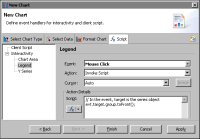
For both types of event handlers, you use the script editor in the chart builder, as shown in Figure 23‑7. To launch the script editor, choose the Script tab.
Figure 23‑7 Script editor displaying the UI for writing a chart event handler
To create an event handler that responds to a user interaction, choose Interactivity. To create an event handler that responds to a chart event, choose Client Script, as shown in Figure 23‑7.
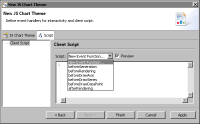
Scripts that you write using Client Script apply to HTML5 charts only. If you later change a chart’s output format from HTML5 to SVG, BIRT ignores these client‑side scripts when generating the chart. You can also add Client Scripts to the JavaScript chart theme to share the script among multiple HTML5 charts using the script editor in the Chart Theme Wizard, as shown in Figure 23‑8.
Figure 23‑8 Script editor displaying the chart event handler interface
Writing event handlers that respond to user interactions
Depending on what you want to accomplish, you can create some of these interactivity event handlers without scripting. For typical event handlers, the script editor in the chart builder simplifies the process by providing a list of chart elements, a list of events, and a list of actions. Select the chart element you want to make interactive, select an event, such as Mouse Click or Mouse Over, then select an action, such as Show Tooltip or Hyperlink. To implement a custom action, choose Invoke Script, then write JavaScript code. For HTML5 charts, this code can use the Highcharts API.
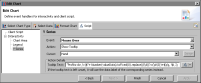
Figure 23‑9 shows an example of an event handler defined for a chart’s Y series. The event handler runs when the Mouse Over event is triggered. When triggered, the Show Tooltip action runs. In this example, the tooltip is set to display the series data, which is typical.
Figure 23‑9 Script editor displaying an interactivity event handler
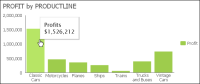
Figure 23‑10 shows the results of the previous event handler. When the user places the mouse pointer over the first bar in the bar chart, a tooltip displays the series data value.
Figure 23‑10 A tooltip displays a bar’s data value when the user places the mouse pointer over the bar
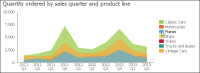
Figure 23‑11 shows an example of an event handler defined for a chart’s legend. The event handler runs when the Mouse Click event is triggered. When triggered, the Invoke Script action runs. In this example, the following script brings a series in an area chart to the front when the user clicks the series name in the legend:
evt.target.group.toFront();
This line of code calls a method in the Highcharts API.
Figure 23‑11 Script editor displaying an event handler that runs a script
Figure 23‑12 shows the results of the previous event handler. When the user clicks the In Process value in the area chart’s legend, the corresponding series in the chart displays in front of the other overlapping series.
Figure 23‑12 In Process series displayed in front when the user clicks the series name in the legend
Compared to BIRT charts, HTML5 charts support fewer events and actions, and fewer chart elements on which to define event handlers. The additional events that BIRT charts support, but that HTML5 charts do not, include Mouse Down, Mouse Up, Mouse Move, Key Down, and Key Up. The additional chart elements for which you can define event handlers in a BIRT chart, but not an HTML5 chart, include the chart title, y-axis, and x‑axis.
If you begin by creating a BIRT chart, then later change the output format to HTML5, BIRT ignores the event handlers defined for events that are specific to a BIRT chart when generating the chart. This behavior provides the flexibility of creating and maintaining event handlers for either chart format with the option of changing the chart format at any time without any additional changes to the design.
Writing event handlers that respond to chart events
Unlike event handlers that respond to user interactions with the chart, the event handlers that you write for chart events require programming in JavaScript. You also have to review the Highcharts API to know what chart options you can manipulate and how.
In the script editor, you select an event function, such as beforeRendering( ) or beforeDrawAxis( ), then you write code that performs a specific task or tasks when the chart event occurs. The event handlers that you write for HTML5 chart events differ from the event handlers for BIRT charts in several important aspects, as described in Table 23‑2.
Table 23‑2 Comparison of event handlers in HTML5 charts and BIRT charts
Event handlers in HTML5 charts
Event handlers in BIRT charts
Support only JavaScript
Support JavaScript and Java
Use client-side scripting and limited server-side scripting
Use server-side scripting only
Use the Highcharts API
Use BIRT charting API
Write client-side scripts using the script editor accessible from the Script tab in the chart builder. Write server-side scripts using the script editor accessible from the Script tab in the report editor. Only the following server-side event functions are supported for HTML5 charts: beforeDataSetFilled( ), afterDataSetFilled( ), and beforeGeneration( )
This section provides information about writing client-side event handlers for HTML5 chart events. For information about writing server-side event handlers, see Working with chart event handlers.
For documentation about the Highcharts API, go to the following location:
http://api.highcharts.com/highcharts
About the HTML5 chart events
The set of events for an HTML5 chart is much smaller than the set of events for a BIRT chart. Table 23‑3 lists the HTML5 chart event functions and describes when they are called.
The before functions are called after BIRT generates the static JavaScript options, which are based on the chart’s data and formatting options set in the chart builder. The beforeGeneration( ) function is the first function called after the generation of the static JavaScript options, but before a chart object is created. Use beforeGeneration( ) to add chart options that Highcharts provides, but that are not available through the chart builder’s format page.
For example, Highcharts provides a credits option to display a credits label in the chart. To add this label to the lower right corner of the chart (the default position), you would write code as follows:
beforeGeneration: function(options)
{
options.credits = {
enabled: true,
text: 'Acme Inc.'
};
},
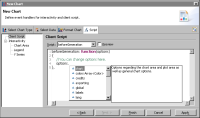
As the code example shows, beforeGeneration( ) receives an options object. You use this options object to configure chart options. When you type the word, options, followed by a period (.), the script editor displays a list of options, as shown in Figure 23‑13. Click an option to view summary information about it. Double-click an option to add it to your code.
Figure 23‑13 The script editor displaying the available options
The other before functions also receive an options object, for example, axisOptions or seriesOptions, which is specific to the associated chart element. Your code typically makes changes to the options object to change the appearance of an axis, series, or data point. The following code example shows how to use beforeDrawSeries( ) and the seriesOptions object to display a legend for all series types except pie:
All the before functions, except beforeGeneration( ), also receive the chart object, which represents the chart that is created based on the original static options and any options created with beforeGeneration( ). With the exception of beforeGeneration( ), your code can query the chart object to determine what changes to make to the options. You typically use these before functions to dynamically add, change, or remove a chart element based on specified conditions. Avoid making make any changes with your code to the chart object itself because it is a temporary object. Changes to this temporary chart are discarded along with the chart.
After the before functions run, BIRT passes the original options and your scripted options into a constructor to create a new chart object. The afterRendering( ) function provides the final opportunity to make changes to this new chart object. To get the chart object, use the getCore( ) method, as shown in the following code snippet:
afterRendering: function(Chart)
{
myChart=Chart.getCore();
...
Scripting example 1
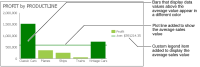
The bar chart in Figure 23‑14 shows the following custom options that are added through scripting:
A script in beforeDrawSeries( ) calculates the average sales total, and changes the color of bars that show data values above the average value.
A script in afterRendering( ) draws a plot line on the y-axis to show the average value, and adds a legend item to display the average value.
Figure 23‑14 Customized options in a bar chart
The event handlers written for the bar chart appear in Listing 23‑2.
Listing 23‑2 Event-handling script for the bar chart with customized options
// The data point is above average. Color it green
var pointOptions = seriesOptions.data[j];
pointOptions.color = 'green';
}
},
afterRendering: function(myChart)
{
var chart=myChart.getCore();
var mySeries = chart.series[0];
// Assuming aveValue was set in the beforeDrawSeries function,
// draw a plot line at the average value.
mySeries.yAxis.addPlotLine({
color: 'green',
width: 2,
value: aveValue,
id: 'averageValuePlotLine',
zIndex: 2
});
// Add a legend item that labels the plot line
// Do this by adding an empty series
chart.addSeries({
color: 'green',
name: 'Ave: $' + aveValue.toFixed(2),
marker: {
enabled: false
}
});
},
Scripting example 2
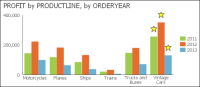
The bar chart in Figure 23‑15 shows custom objects, stars, that are added through scripting. Each star indicates the highest value for each order status series.
Figure 23‑15 Bar chart with custom objects
A script in afterRendering( ) performs the following tasks:
Calculates the highest (max) value for each y‑series
Draws a star based on the width of the bar
Positions the stars at the top of the appropriate bars
This script showcases Highchart’s renderer object, which supports drawing shapes, such as circles, rectangles, and stars, and adding images and text to a chart. The renderer is useful for adding annotations to a chart. For example, instead of a star, you can annotate the max value by creating text and enclosing it in a rectangle.
The JavaScript code written for this bar chart appears in Listing 23‑3.
Listing 23‑3 Event-handling script for the bar chart with custom objects
afterRendering: function(myChart)
{
// Annotate the max value in each series with a
// star drawn above the column
var chart=myChart.getCore();
// Loop through each series
for ( var i = 0; i < chart.series.length; i++ )
{
var mySeries = chart.series[i];
var maxValue = mySeries.data[0].y;
var maxValueIdx = 0;
if ( !maxValue )
{
maxValue = 0;
}
// First, find the max value for this series
for ( var j = 1; j < mySeries.data.length; j++ )
{
var curValue = mySeries.data[j].y;
if ( !curValue )
{
continue;
}
if ( maxValue < mySeries.data[j].y )
{
maxValue = mySeries.data[j].y;
maxValueIdx = j;
}
}
var maxPoint = mySeries.data[maxValueIdx];
// Now that we have the max value, annotate its column
// with a star. Create a group to hold each annotation.
var group = chart.renderer.g().add();
var barW = maxPoint.shapeArgs.width;
var barX = maxPoint.shapeArgs.x;
var barY = maxPoint.shapeArgs.y;
// Draw a star based on the width of the column,
// and add it to the group
var star = chart.renderer.path(['M', barW/2, 0,
'L',
barW*.4, barW/4,
barW*.05, barW/4,
barW*.325, barW*.475,
barW*.2, barW*.85,
barW/2, barW*.6,
barW*.8, barW*.85,
barW*.675, barW*.475,
barW*.95, barW/4,
barW*.6, barW/4,
'Z'])
.attr({
fill : 'yellow',
stroke: 'black',
'stroke-width': 1
}).add(group);
// The following tags add interactivites to the star using SMIL
// animation. SMIL is a subset of SVG that is not supported in
// all browser environments. These tags are added to
// demonstrate additional interactivity and animation that can
// be added via SVG tags - best previewed using Firefox.
// Add jump animation on mouse over.
var jump = chart.renderer.createElement('animateMotion')
.attr({
begin : 'mouseover;touchstart',
calcMode : 'paced',
path : "M 0 0 L 0 -25 L 0 0",
dur : '1s',
fill : 'freeze',
additive : 'sum'
}).add(star);
// Add rotate animation on mouse over
var rotate = chart.renderer.createElement('animateTransform')
.attr({
begin : 'mouseover;touchstart',
attributeName : 'transform',
type : 'rotate',
from : '0 ' + barW/2 + ' ' + barW/2,
to : "360 " + barW/2 + " " + barW/2,
dur : '1s',
additive : 'sum'
}).add(star);
// Add turn to red fill to the star on mouse click
var turnToRed = chart.renderer.createElement('set')
.attr({
begin : 'click',
attributeName : 'fill',
to : 'red'
}).add(star);
// Move the group to the top of the correct bar,
// and set it to draw in front of everything in the chart
group.attr({
translateX: barX + chart.plotLeft,
translateY: barY + chart.plotTop - barW - 10
});
group.toFront();
}
},
Scripting example 3
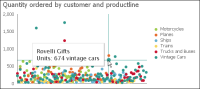
The scatter chart in Figure 23‑16 shows a vertical and horizontal plot line and tooltip that appear when the mouse pointer is placed over a data point. The plot line and tooltip disappear when the mouse pointer is moved away from a data point.
Figure 23‑16 Scatter chart displaying a dynamic plot line and tooltip
The event-handling script to display and remove the plot line dynamically appears in Listing 23‑4.
Listing 23‑4 Event-handling script to display a plot line dynamically