Measurement gadgets are visualizations that typically measure a value in a visual range. These visualizations display values from a BIRT data object and are typically smaller than a multi-axis chart.
Choosing a measurement type
The following types of measurement gadgets are available in the dashboard editor:
Bullet
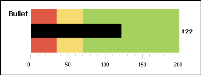
A bullet gadget is a variation of a bar chart that measures the value of a single data column in a horizontal or vertical orientation. You can display colored regions for comparison. Figure 17‑29 shows a bullet gadget.
Figure 17‑29 Displaying a horizontal bullet gadget
Cylinder
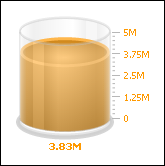
A cylinder gadget displays the value of a single data column as the fill level of a vertical cylinder. Figure 17‑30 shows a cylinder gadget.
Figure 17‑30 Displaying a cylinder gadget
Linear gauge
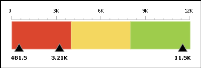
A linear gauge gadget displays the value of one or more data columns as needles on a horizontal scale. You can display colored regions for comparison. Figure 17‑31 shows a linear gauge gadget.
Figure 17‑31 Displaying a linear gauge gadget
Meter
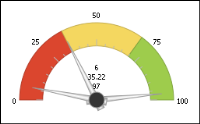
A meter gadget is an angular gauge that displays the value of one or more data columns as dial values on a radial scale. You can display colored regions for comparison. Figure 17‑32 shows a meter gadget.
Figure 17‑32 Displaying a meter gadget
Sparkline
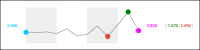
A sparkline gadget is a small variation of a line chart that displays the value of a numeric data column and highlights the high, low, open, and close values. You can group values with a second data column when displaying a data cube. Figure 17‑33 shows a sparkline gadget.
Figure 17‑33 Displaying a sparkline gadget
Thermometer
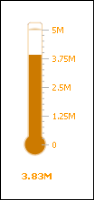
A thermometer gadget displays the value from a single data column as the fill level of a vertical thermometer. Figure 17‑34 shows a thermometer gadget.
Figure 17‑34 Displaying a thermometer gadget
Selecting data for measurement gadgets
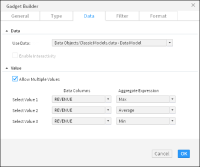
You select data to display in Gadget Builder—Data when you create or edit a measurement gadget. Choose a BIRT data object and select a data set, data model, or data cube. Next, select a data column to display in the measurement gadget. Meter and linear gauges can display one, two, or three different data columns. Sparklines support using a second data column to group the primary data column values. Figure 17‑35 shows the data sources for a linear gauge gadget.
Figure 17‑35 Selecting data to display in a linear gauge gadget
If hyperlinks exist in the data object file, they can appear in the measurement gadget by selecting Gadget Builder➛Data➛Enable Interactivity. Hyperlinks enable users to open a URI or drill through to another BIRT document file when choosing a value in the measurement gadget. This is similar to a hyperlink on a web page.
Aggregating measurement data
When you display a data cube in a measurement gadget, you select from aggregations that are included in the data cube. These aggregated fields are called measures and were added to the data cube when it was created in BIRT Designer Professional.
When you display a data set or a data model in a measurement gadget, you can aggregate the field by selecting an aggregation function. You can use the count and distinct count aggregate functions for data columns that contain non-numeric values such as strings and dates. Table 17‑4 shows the aggregation functions available for numeric data displayed in a measurement gadget.
Table 17‑4 Aggregate functions for measurement gadgets
Function
Description
Average
Returns the average of the values
Count
Returns the number of values, including duplicate values
Distinct Count
Returns the number of values, excluding duplicate values
First
Returns the first value among the values
Last
Returns the last value among the values
Max
Returns the largest value among the values
Min
Returns the smallest value among the values
Sum
Returns the sum of the values
Formatting measurement gadgets
You can format and enhance your gadget in Gadget Builder—Format. You can show values on the measurement, change the size of the measurement, and control the scale of the visualization by setting minimum and maximum values. You can also change the number of tick marks to display and their position on the visualization, except for the sparkline gadget, which displays open, close, high, and low plot points in place of tick marks.
You can also change the font, font size, and font color used to display values in measurement gadgets. Enable tooltips to display values when a mouse hovers over points in the visualization.
Using regions
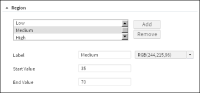
The bullet, linear gauge, and meter gadgets support highlighting multiple ranges of values using regions. Regions is a formatting option where you determine the start and end value, color, and name of each region. If a region overlaps another, the last region that you create takes precedence. Figure 17‑36 shows settings for the Medium region.
Figure 17‑36 Defining region values and color
Changing color
You can change the color of the bullet, cylinder, and thermometer gadgets.
Using pointers
The linear gauge gadget uses needles and a meter gadget uses dials as pointers to indicate values. You can display the value next to these pointers and for linear gauge gadgets, you can choose the position of these pointers on the gadget.